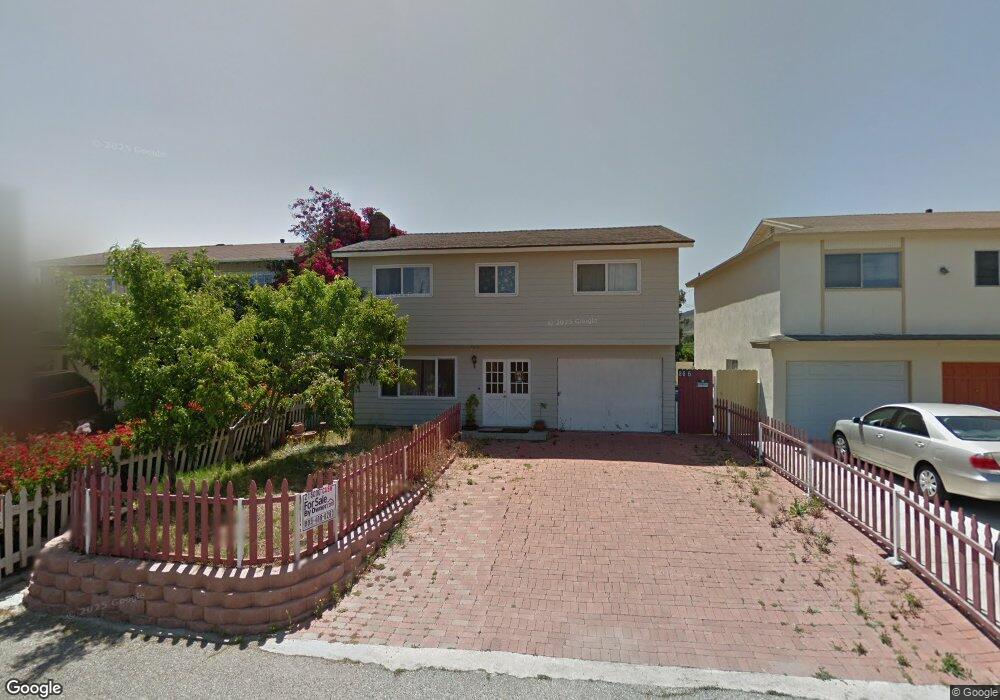
866 Vinton Ct Thousand Oaks, CA 91360
Estimated Value: $747,088 - $915,000
4
Beds
--
Bath
1,551
Sq Ft
$541/Sq Ft
Est. Value
About This Home
This home is located at 866 Vinton Ct, Thousand Oaks, CA 91360 and is currently estimated at $839,272, approximately $541 per square foot. 866 Vinton Ct is a home located in Ventura County with nearby schools including Glenwood Elementary School, Colina Middle School, and Westlake High School.
Ownership History
Date
Name
Owned For
Owner Type
Purchase Details
Closed on
May 26, 1999
Sold by
Marino Olivia
Bought by
Marino Robert and Marino Olivia
Current Estimated Value
Purchase Details
Closed on
Oct 14, 1998
Sold by
Veroljub Radivojevic and Radivojevic Jovanka
Bought by
Marino Olivia
Home Financials for this Owner
Home Financials are based on the most recent Mortgage that was taken out on this home.
Original Mortgage
$127,960
Outstanding Balance
$27,750
Interest Rate
6.79%
Mortgage Type
Stand Alone First
Estimated Equity
$811,522
Purchase Details
Closed on
Sep 9, 1998
Sold by
Marino Robert
Bought by
Marino Olivia
Home Financials for this Owner
Home Financials are based on the most recent Mortgage that was taken out on this home.
Original Mortgage
$127,960
Outstanding Balance
$27,750
Interest Rate
6.79%
Mortgage Type
Stand Alone First
Estimated Equity
$811,522
Purchase Details
Closed on
Mar 19, 1997
Sold by
Veroljub Radivojevic
Bought by
Radivojevic Veroljub and Radivojevic Jovanka
Create a Home Valuation Report for This Property
The Home Valuation Report is an in-depth analysis detailing your home's value as well as a comparison with similar homes in the area
Home Values in the Area
Average Home Value in this Area
Purchase History
| Date | Buyer | Sale Price | Title Company |
|---|---|---|---|
| Marino Robert | -- | Chicago Title Co | |
| Marino Olivia | $160,000 | Chicago Title Co | |
| Marino Olivia | -- | -- | |
| Radivojevic Veroljub | -- | -- |
Source: Public Records
Mortgage History
| Date | Status | Borrower | Loan Amount |
|---|---|---|---|
| Open | Marino Olivia | $127,960 |
Source: Public Records
Tax History Compared to Growth
Tax History
| Year | Tax Paid | Tax Assessment Tax Assessment Total Assessment is a certain percentage of the fair market value that is determined by local assessors to be the total taxable value of land and additions on the property. | Land | Improvement |
|---|---|---|---|---|
| 2025 | $2,957 | $250,722 | $195,951 | $54,771 |
| 2024 | $2,957 | $245,806 | $192,108 | $53,698 |
| 2023 | $2,849 | $240,987 | $188,341 | $52,646 |
| 2022 | $2,794 | $236,262 | $184,648 | $51,614 |
| 2021 | $2,742 | $231,630 | $181,028 | $50,602 |
| 2020 | $2,410 | $229,257 | $179,173 | $50,084 |
| 2019 | $2,346 | $224,762 | $175,660 | $49,102 |
| 2018 | $2,298 | $220,356 | $172,216 | $48,140 |
| 2017 | $2,253 | $216,037 | $168,840 | $47,197 |
| 2016 | $2,230 | $211,802 | $165,530 | $46,272 |
| 2015 | $2,191 | $208,623 | $163,045 | $45,578 |
| 2014 | $2,159 | $204,538 | $159,852 | $44,686 |
Source: Public Records
Map
Nearby Homes
- 245 Houston Dr
- 163 Houston Dr
- 978 Bower Way
- 647 Brossard Dr
- 1000 E Thousand Oaks Blvd
- 566 Rancho Rd
- 1340 E Hillcrest Dr Unit 8
- 1342 E Hillcrest Dr Unit 20
- 1248 La Peresa Dr
- 110 Maegan Place Unit 13
- 918 Rancho Rd
- 68 Maegan Place Unit 7
- 62 Maegan Place Unit 4
- 331 Dryden St
- 86 Maegan Place Unit 4
- 56 Maegan Place Unit 4
- 1649 Hauser Cir
- 932 Rosario Dr
- 1710 E Thousand Oaks Blvd
- 1116 Rexford Place