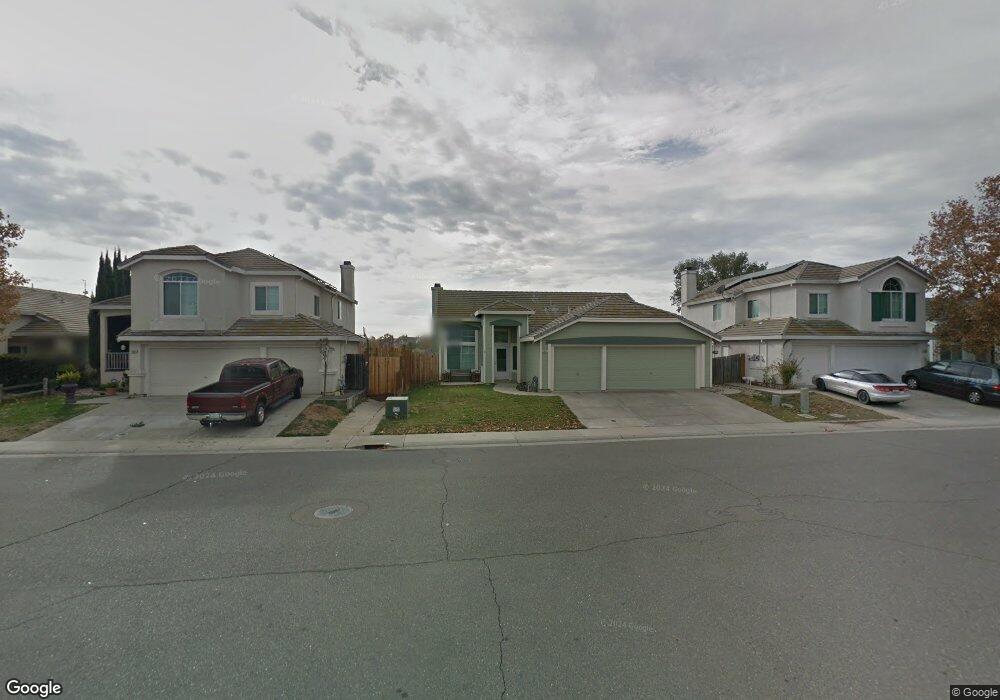
8664 Scarlet Sage Way Elk Grove, CA 95624
North East Elk Grove NeighborhoodEstimated Value: $449,000 - $594,000
4
Beds
2
Baths
1,668
Sq Ft
$327/Sq Ft
Est. Value
About This Home
This home is located at 8664 Scarlet Sage Way, Elk Grove, CA 95624 and is currently estimated at $544,781, approximately $326 per square foot. 8664 Scarlet Sage Way is a home located in Sacramento County with nearby schools including Raymond Case Elementary School, Edward Harris Jr. Middle School, and Monterey Trail High School.
Ownership History
Date
Name
Owned For
Owner Type
Purchase Details
Closed on
Aug 6, 2013
Sold by
Meier Richard T and Meier Delores
Bought by
Meier Richard Thomas and Meier Delores
Current Estimated Value
Purchase Details
Closed on
Jul 12, 2010
Sold by
Stief Sharon J and Stief Shari J
Bought by
Meier Richard
Purchase Details
Closed on
Jun 11, 2003
Sold by
Alston Christopher J and Alston Brandi M
Bought by
Stief Sharon J
Home Financials for this Owner
Home Financials are based on the most recent Mortgage that was taken out on this home.
Original Mortgage
$185,500
Interest Rate
5.61%
Mortgage Type
Stand Alone First
Purchase Details
Closed on
Dec 17, 1996
Sold by
M J Brock & Sons Inc
Bought by
Alston Christopher J and Alston Brandi M
Home Financials for this Owner
Home Financials are based on the most recent Mortgage that was taken out on this home.
Original Mortgage
$136,043
Interest Rate
7.67%
Mortgage Type
FHA
Create a Home Valuation Report for This Property
The Home Valuation Report is an in-depth analysis detailing your home's value as well as a comparison with similar homes in the area
Home Values in the Area
Average Home Value in this Area
Purchase History
| Date | Buyer | Sale Price | Title Company |
|---|---|---|---|
| Meier Richard Thomas | -- | None Available | |
| Meier Richard T | -- | None Available | |
| Meier Richard | $204,000 | Placer Title Company | |
| Stief Sharon J | $265,000 | Chicago Title Co | |
| Alston Christopher J | $139,000 | Placer Title Company |
Source: Public Records
Mortgage History
| Date | Status | Borrower | Loan Amount |
|---|---|---|---|
| Previous Owner | Stief Sharon J | $185,500 | |
| Previous Owner | Alston Christopher J | $136,043 |
Source: Public Records
Tax History Compared to Growth
Tax History
| Year | Tax Paid | Tax Assessment Tax Assessment Total Assessment is a certain percentage of the fair market value that is determined by local assessors to be the total taxable value of land and additions on the property. | Land | Improvement |
|---|---|---|---|---|
| 2025 | $3,022 | $261,346 | $89,675 | $171,671 |
| 2024 | $3,022 | $256,222 | $87,917 | $168,305 |
| 2023 | $2,945 | $251,199 | $86,194 | $165,005 |
| 2022 | $2,890 | $246,274 | $84,504 | $161,770 |
| 2021 | $2,848 | $241,447 | $82,848 | $158,599 |
| 2020 | $2,809 | $238,972 | $81,999 | $156,973 |
| 2019 | $2,757 | $234,288 | $80,392 | $153,896 |
| 2018 | $2,684 | $229,695 | $78,816 | $150,879 |
| 2017 | $2,637 | $225,192 | $77,271 | $147,921 |
| 2016 | $2,508 | $220,777 | $75,756 | $145,021 |
| 2015 | $2,462 | $217,462 | $74,619 | $142,843 |
| 2014 | $2,423 | $213,203 | $73,158 | $140,045 |
Source: Public Records
Map
Nearby Homes
- 8578 Hydrangea Ct
- 8805 Coral Berry Way
- 8809 Coral Berry Way
- 8541 Lupin Way
- 8788 Apricot Woods Way
- 8659 Tegea Way
- 8643 Rothenburg Ct
- 8679 Bouvardia Ct
- 8609 Aviary Woods Way
- 8697 Tegea Way
- 8831 Liscarney Way
- 8772 Crusheen Way
- 8770 Bottlebrush Ct
- 8738 Freesia Dr
- 8836 Inisheer Way
- 8874 Autumn Gold Ct
- 8447 Cassatt Way
- Plan 1 at Heartstone
- Plan 2 at Heartstone
- Plan 3 at Heartstone
- 8660 Scarlet Sage Way
- 8668 Scarlet Sage Way
- 8656 Scarlet Sage Way
- 8672 Scarlet Sage Way
- 8480 Mockenhaupt Ct
- 8481 Mockenhaupt Ct
- 8652 Scarlet Sage Way
- 8476 Mockenhaupt Ct
- 8477 Mockenhaupt Ct
- 8648 Scarlet Sage Way
- 8472 Mockenhaupt Ct
- 8477 Water Poppy Way
- 8473 Mockenhaupt Ct
- 8644 Scarlet Sage Way
- 8473 Water Poppy Way
- 8468 Mockenhaupt Ct
- 8469 Mockenhaupt Ct
- 8640 Scarlet Sage Way
- 8480 Water Poppy Way
- 8469 Water Poppy Way