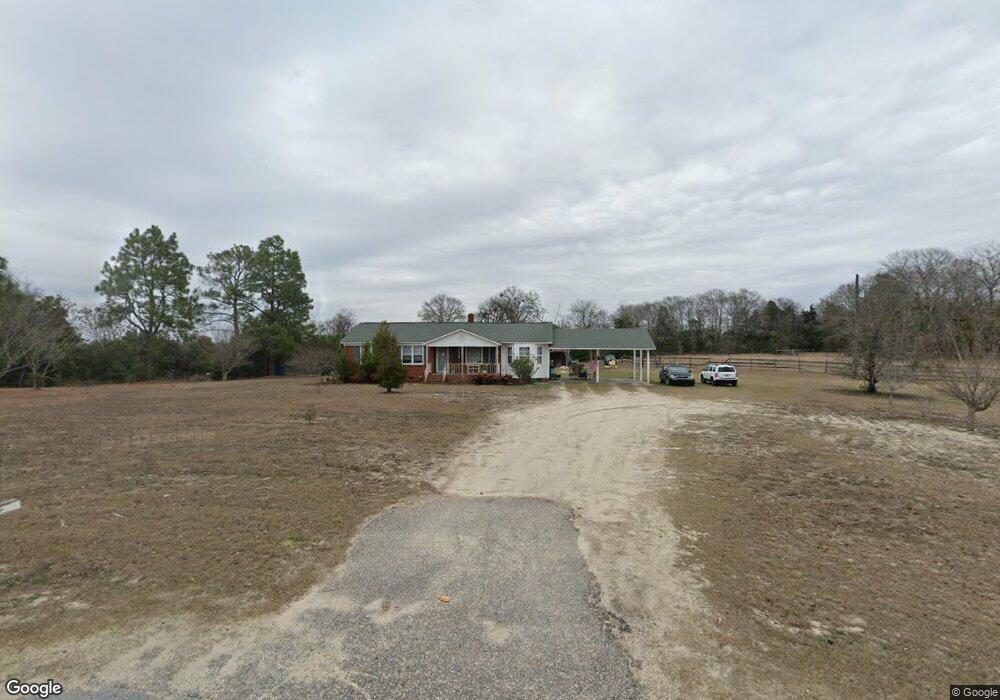
8665 Black River Rd Rembert, SC 29128
Estimated Value: $194,000 - $243,072
3
Beds
2
Baths
1,406
Sq Ft
$160/Sq Ft
Est. Value
About This Home
This home is located at 8665 Black River Rd, Rembert, SC 29128 and is currently estimated at $224,268, approximately $159 per square foot. 8665 Black River Rd is a home located in Sumter County with nearby schools including Rafting Creek Elementary School, Ebenezer Middle School, and Crestwood High School.
Ownership History
Date
Name
Owned For
Owner Type
Purchase Details
Closed on
Oct 28, 2022
Sold by
Mcmanus John A
Bought by
Mcmanus Joshua and Mcmanus Katherine N
Current Estimated Value
Home Financials for this Owner
Home Financials are based on the most recent Mortgage that was taken out on this home.
Original Mortgage
$125,000
Outstanding Balance
$121,103
Interest Rate
6.92%
Mortgage Type
New Conventional
Estimated Equity
$103,165
Purchase Details
Closed on
Jul 23, 2017
Sold by
Mcmanus John A
Bought by
Mcmanus Marion Wayne
Purchase Details
Closed on
Jun 23, 2017
Sold by
Mcmanus John A and Michael Mcmanus Revocable T R
Bought by
Mcmanus Emily M and Mcmanus John A
Purchase Details
Closed on
Dec 23, 2009
Sold by
Mcmanus R Michael
Bought by
Mcmanus R Michael
Purchase Details
Closed on
Feb 14, 2006
Sold by
Mcmanus John M
Bought by
Mcmanus R Michael
Create a Home Valuation Report for This Property
The Home Valuation Report is an in-depth analysis detailing your home's value as well as a comparison with similar homes in the area
Home Values in the Area
Average Home Value in this Area
Purchase History
| Date | Buyer | Sale Price | Title Company |
|---|---|---|---|
| Mcmanus Joshua | $180,000 | -- | |
| Mcmanus Marion Wayne | -- | None Available | |
| Mcmanus Emily M | -- | None Available | |
| Mcmanus R Michael | -- | -- | |
| Mcmanus R Michael | -- | None Available |
Source: Public Records
Mortgage History
| Date | Status | Borrower | Loan Amount |
|---|---|---|---|
| Open | Mcmanus Joshua | $125,000 |
Source: Public Records
Tax History Compared to Growth
Tax History
| Year | Tax Paid | Tax Assessment Tax Assessment Total Assessment is a certain percentage of the fair market value that is determined by local assessors to be the total taxable value of land and additions on the property. | Land | Improvement |
|---|---|---|---|---|
| 2024 | $1,047 | $6,530 | $740 | $5,790 |
| 2023 | $3,235 | $6,530 | $740 | $5,790 |
| 2022 | $1,227 | $3,590 | $690 | $2,900 |
| 2021 | $13 | $2,390 | $460 | $1,930 |
| 2020 | $92 | $2,150 | $460 | $1,690 |
| 2019 | $90 | $2,150 | $460 | $1,690 |
| 2018 | $87 | $2,150 | $460 | $1,690 |
| 2017 | $93 | $2,200 | $460 | $1,740 |
| 2016 | $93 | $2,200 | $460 | $1,740 |
| 2015 | $99 | $2,250 | $460 | $1,790 |
| 2014 | $99 | $2,250 | $460 | $1,790 |
| 2013 | -- | $2,250 | $460 | $1,790 |
Source: Public Records
Map
Nearby Homes
- 5635 Halley Rd
- 5605 Halley Rd
- 0 Huggins Rd
- 8107 Black River Rd
- 0 Pisgah Rd Unit 596495
- 000 Columbus Rd Unit 8
- 0000 Columbus Rd
- 0 Columbus Rd Unit 170162
- 0 Columbus Rd Unit 6 CAR4198379
- 00 Columbus Rd Unit 9
- 00 Columbus Rd Unit 7
- 1346 Wells Rd
- 5051 Spring Hill Rd
- 91 Shiver Rd
- 00 Black River Rd
- 0 Black River Rd Unit 1 CAR4198364
- 0 Black River Rd
- 361 Sweet Street Lots 4
- 361 Sweet St Unit 2
- 361 Sweet St Unit 6
- 8635 Black River Rd
- 8620 Black River Rd
- 8735 Black River Rd
- 8780 Black River Rd
- 5545 Halley Rd
- 8795 Black River Rd
- 5445 Halley Rd
- 8810 Black River Rd
- 5500 Halley Rd
- 5480 Halley Rd
- 5470 Halley Rd
- 8075 Saint Johns Rd
- 8045 Saint Johns Rd
- 8170 Saint Johns Rd
- 5430 Halley Rd
- 8125 Saint Johns Rd
- 8490 Black River Rd
- 8840 Black River Rd
- Track I Saint Johns Rd
- Track G Saint Johns Rd