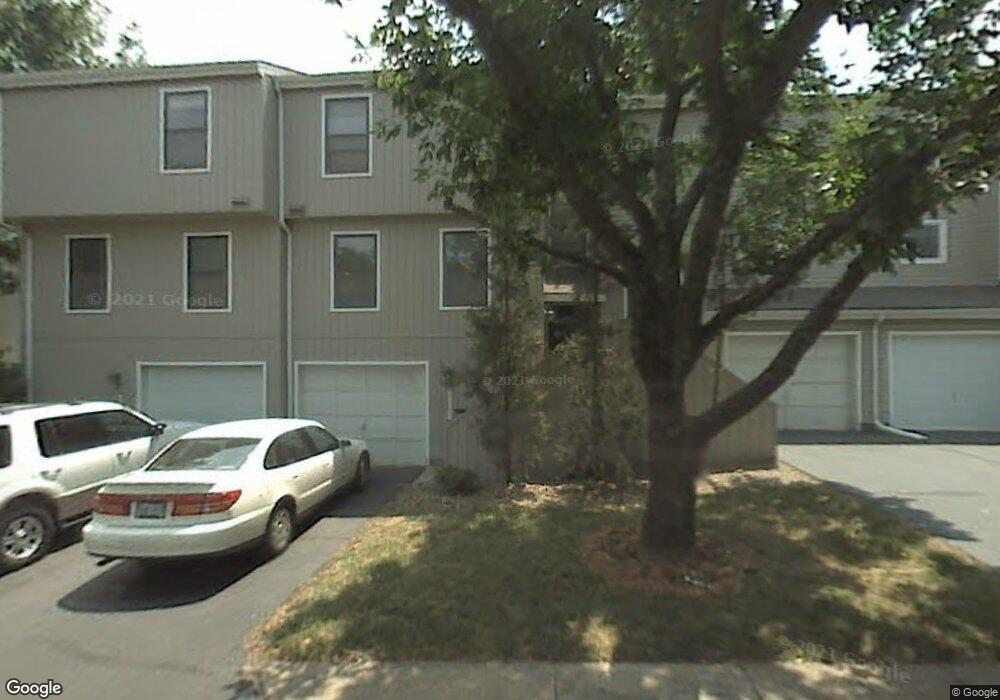
8669 W 108th Place Overland Park, KS 66210
Central Overland Park NeighborhoodEstimated Value: $218,000 - $249,000
2
Beds
2
Baths
1,156
Sq Ft
$198/Sq Ft
Est. Value
About This Home
This home is located at 8669 W 108th Place, Overland Park, KS 66210 and is currently estimated at $228,980, approximately $198 per square foot. 8669 W 108th Place is a home located in Johnson County with nearby schools including Valley Park Elementary School, Overland Trail Middle School, and Blue Valley North High School.
Ownership History
Date
Name
Owned For
Owner Type
Purchase Details
Closed on
Jun 14, 2021
Sold by
Lister Linda
Bought by
Lister Linda and Lister Michael Ray
Current Estimated Value
Purchase Details
Closed on
May 18, 2005
Sold by
Pacheco Maria
Bought by
Lister Linda C
Purchase Details
Closed on
Feb 22, 2003
Sold by
Arlen Scott and Arlen Kathleen
Bought by
Pacheco Maria
Home Financials for this Owner
Home Financials are based on the most recent Mortgage that was taken out on this home.
Original Mortgage
$112,000
Interest Rate
5.93%
Purchase Details
Closed on
Jun 6, 2001
Sold by
Alvarez Joseph A
Bought by
Arlen Scott and Arlen Kathleen
Home Financials for this Owner
Home Financials are based on the most recent Mortgage that was taken out on this home.
Original Mortgage
$107,500
Interest Rate
7.1%
Create a Home Valuation Report for This Property
The Home Valuation Report is an in-depth analysis detailing your home's value as well as a comparison with similar homes in the area
Home Values in the Area
Average Home Value in this Area
Purchase History
| Date | Buyer | Sale Price | Title Company |
|---|---|---|---|
| Lister Linda | -- | None Listed On Document | |
| Lister Linda C | -- | Kansas Ctiy Title | |
| Pacheco Maria | -- | Columbian Title Of Johnson C | |
| Arlen Scott | -- | Chicago Title Insurance Co |
Source: Public Records
Mortgage History
| Date | Status | Borrower | Loan Amount |
|---|---|---|---|
| Previous Owner | Pacheco Maria | $112,000 | |
| Previous Owner | Arlen Scott | $107,500 |
Source: Public Records
Tax History Compared to Growth
Tax History
| Year | Tax Paid | Tax Assessment Tax Assessment Total Assessment is a certain percentage of the fair market value that is determined by local assessors to be the total taxable value of land and additions on the property. | Land | Improvement |
|---|---|---|---|---|
| 2024 | $2,092 | $21,229 | $3,343 | $17,886 |
| 2023 | $1,996 | $19,515 | $3,343 | $16,172 |
| 2022 | $1,852 | $17,802 | $2,571 | $15,231 |
| 2021 | $1,796 | $16,134 | $2,571 | $13,563 |
| 2020 | $1,844 | $16,468 | $2,236 | $14,232 |
| 2019 | $1,715 | $14,996 | $2,236 | $12,760 |
| 2018 | $1,721 | $14,754 | $2,032 | $12,722 |
| 2017 | $1,627 | $13,719 | $1,935 | $11,784 |
| 2016 | $1,625 | $13,696 | $1,935 | $11,761 |
| 2015 | $1,515 | $12,753 | $1,935 | $10,818 |
| 2013 | -- | $12,167 | $1,935 | $10,232 |
Source: Public Records
Map
Nearby Homes
- 8607 W 108 Place
- 11163 Eby St
- 8500 W 113th St
- 8819 W 106th Terrace
- 8858 W 106th Terrace
- 8712 W 113th St
- 11316 Hemlock St
- 11404 Grandview Dr
- 8726 W 104th St
- 9013 W 115th St
- 9006 W 104th Terrace
- 9604 W 106th St
- 11447 Craig St
- 9504 W 104th St
- 9601 W 104th Terrace
- 11309 Riley St
- 11422 Conser St
- 10529 Wedd St
- 9701 W 104th St
- 9805 W 104th Terrace
- 8675 W 108th Place Unit C
- 8663 W 108th Place
- 8681 W 108th Place
- 8687 W 108th Place
- 8657 W 108th Place
- 8693 W 108th Place
- 8651 W 108th Place
- 8645 W 108th Place
- 8680 W 109th St
- 8690 W 109th St
- 8670 W 109th St
- 8660 W 109th St
- 8698 W 108th Place
- 8639 W 108th Place
- 8650 W 109th St
- 8640 W 109th St
- 8694 W 108th Place
- 8642 W 108th Place
- 8690 W 108th Place
- 8630 W 109th St