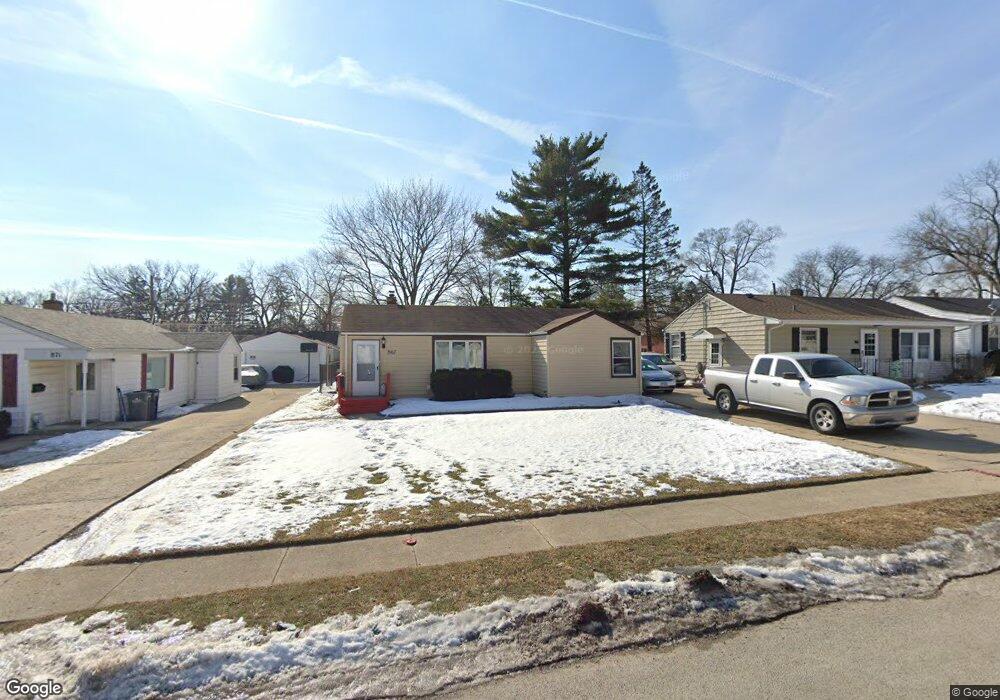
867 Jay St Elgin, IL 60120
Southeast Elgin NeighborhoodEstimated Value: $218,000 - $261,000
2
Beds
1
Bath
872
Sq Ft
$279/Sq Ft
Est. Value
About This Home
This home is located at 867 Jay St, Elgin, IL 60120 and is currently estimated at $243,244, approximately $278 per square foot. 867 Jay St is a home located in Cook County with nearby schools including Huff Elementary School, Ellis Middle School, and Elgin High School.
Ownership History
Date
Name
Owned For
Owner Type
Purchase Details
Closed on
Jan 29, 2013
Sold by
Meyer Marjorie F M
Bought by
Tirell Llc
Current Estimated Value
Purchase Details
Closed on
Jul 31, 2000
Sold by
Ballard William A and Ballard Tammy T
Bought by
Meyer Marjorie F M
Home Financials for this Owner
Home Financials are based on the most recent Mortgage that was taken out on this home.
Original Mortgage
$98,800
Interest Rate
8.16%
Mortgage Type
Purchase Money Mortgage
Create a Home Valuation Report for This Property
The Home Valuation Report is an in-depth analysis detailing your home's value as well as a comparison with similar homes in the area
Home Values in the Area
Average Home Value in this Area
Purchase History
| Date | Buyer | Sale Price | Title Company |
|---|---|---|---|
| Tirell Llc | $58,500 | None Available | |
| Meyer Marjorie F M | $104,000 | -- |
Source: Public Records
Mortgage History
| Date | Status | Borrower | Loan Amount |
|---|---|---|---|
| Previous Owner | Meyer Marjorie F M | $98,800 |
Source: Public Records
Tax History
| Year | Tax Paid | Tax Assessment Tax Assessment Total Assessment is a certain percentage of the fair market value that is determined by local assessors to be the total taxable value of land and additions on the property. | Land | Improvement |
|---|---|---|---|---|
| 2025 | $4,226 | $18,000 | $4,165 | $13,835 |
| 2024 | $4,226 | $14,682 | $2,380 | $12,302 |
| 2023 | $4,439 | $14,682 | $2,380 | $12,302 |
| 2022 | $4,439 | $15,870 | $2,380 | $13,490 |
| 2021 | $3,564 | $10,344 | $1,636 | $8,708 |
| 2020 | $3,918 | $11,441 | $1,636 | $9,805 |
| 2019 | $3,940 | $12,856 | $1,636 | $11,220 |
| 2018 | $3,113 | $9,163 | $1,487 | $7,676 |
| 2017 | $3,103 | $9,163 | $1,487 | $7,676 |
| 2016 | $3,129 | $9,818 | $1,487 | $8,331 |
| 2015 | $2,964 | $8,436 | $1,338 | $7,098 |
| 2014 | $2,871 | $8,436 | $1,338 | $7,098 |
| 2013 | $2,776 | $8,436 | $1,338 | $7,098 |
Source: Public Records
Map
Nearby Homes
- 711 Bluff City Blvd
- 383 Woodview Cir Unit C
- 1020 Wynnfield Ct Unit D
- 408 Bowen Ct
- 1182 Concord Dr
- 356 Woodview Cir Unit A
- 518 Raymond St
- 483 Barrett St
- 75 Willard Ave Unit 4
- 286 Villa St
- 386 Campus Dr
- 832 Bode Rd
- 277 Gifford Place
- 462 Ashland Ave
- 133 Oak St
- 149 Highbury Dr
- 1701 Deer Pointe Dr
- 7 National St Unit 7
- 3 National St Unit 3
- 162 Festival Ct
Your Personal Tour Guide
Ask me questions while you tour the home.