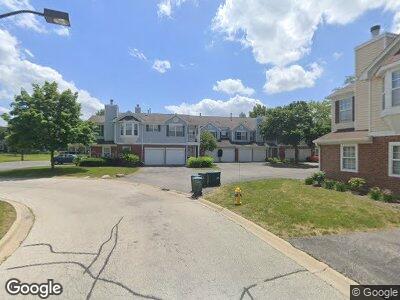
867 Lansing Ct Unit 165 Vernon Hills, IL 60061
Estimated Value: $305,494 - $324,000
--
Bed
2
Baths
1,439
Sq Ft
$217/Sq Ft
Est. Value
About This Home
This home is located at 867 Lansing Ct Unit 165, Vernon Hills, IL 60061 and is currently estimated at $312,624, approximately $217 per square foot. 867 Lansing Ct Unit 165 is a home located in Lake County with nearby schools including Diamond Lake Elementary School, West Oak Middle School, and Adlai E Stevenson High School.
Ownership History
Date
Name
Owned For
Owner Type
Purchase Details
Closed on
Apr 4, 2004
Sold by
Shikora Jack and Shikora Arlys
Bought by
Shikora Arlys
Current Estimated Value
Purchase Details
Closed on
Nov 22, 2002
Sold by
Leathem Jeffrey A and Leathem Leslie E
Bought by
Shikora Jack and Shikora Arlys
Home Financials for this Owner
Home Financials are based on the most recent Mortgage that was taken out on this home.
Original Mortgage
$70,900
Interest Rate
6%
Mortgage Type
Purchase Money Mortgage
Purchase Details
Closed on
Aug 11, 2000
Sold by
Andersen Edith A
Bought by
Leathem Jeffrey A and Leathem Leslie E
Home Financials for this Owner
Home Financials are based on the most recent Mortgage that was taken out on this home.
Original Mortgage
$167,200
Interest Rate
8.75%
Mortgage Type
Purchase Money Mortgage
Create a Home Valuation Report for This Property
The Home Valuation Report is an in-depth analysis detailing your home's value as well as a comparison with similar homes in the area
Home Values in the Area
Average Home Value in this Area
Purchase History
| Date | Buyer | Sale Price | Title Company |
|---|---|---|---|
| Shikora Arlys | -- | -- | |
| Shikora Jack | $217,000 | Chicago Title Insurance Co | |
| Leathem Jeffrey A | $176,000 | Greater Illinois Title Compa |
Source: Public Records
Mortgage History
| Date | Status | Borrower | Loan Amount |
|---|---|---|---|
| Open | Shikora Arlys | $100,000 | |
| Closed | Shikora Arlys | $50,000 | |
| Closed | Shikora Arlys | $57,800 | |
| Closed | Shikora Jack | $80,000 | |
| Previous Owner | Shikora Jack | $70,900 | |
| Previous Owner | Leathem Jeffrey A | $167,200 | |
| Previous Owner | Leathem Jeffrey A | $167,200 |
Source: Public Records
Tax History Compared to Growth
Tax History
| Year | Tax Paid | Tax Assessment Tax Assessment Total Assessment is a certain percentage of the fair market value that is determined by local assessors to be the total taxable value of land and additions on the property. | Land | Improvement |
|---|---|---|---|---|
| 2024 | $3,872 | $87,113 | $26,356 | $60,757 |
| 2023 | $4,383 | $82,198 | $24,869 | $57,329 |
| 2022 | $4,383 | $68,805 | $20,817 | $47,988 |
| 2021 | $4,280 | $68,064 | $20,593 | $47,471 |
| 2020 | $4,207 | $68,296 | $20,663 | $47,633 |
| 2019 | $4,086 | $68,044 | $20,587 | $47,457 |
| 2018 | $4,142 | $60,318 | $22,376 | $37,942 |
| 2017 | $4,145 | $58,910 | $21,854 | $37,056 |
| 2016 | $4,209 | $56,411 | $20,927 | $35,484 |
| 2015 | $4,415 | $52,755 | $19,571 | $33,184 |
| 2014 | $4,770 | $58,011 | $21,020 | $36,991 |
| 2012 | $4,739 | $58,127 | $21,062 | $37,065 |
Source: Public Records
Map
Nearby Homes
- 881 Sparta Ct Unit 66
- 503 Grosse Pointe Cir Unit 44
- 674 Portage Ct Unit 344
- 1143 Orleans Dr Unit 1143
- 814 Kalamazoo Cir Unit 297
- 925 Ann Arbor Ln Unit 247
- 1228 Orleans Dr Unit 1228
- 2369 Glacier St
- 2271 Glacier St
- 2363 Glacier St
- 2267 Glacier St
- 2361 Glacier St
- 2265 Glacier St
- 333 Bloomfield Ct
- 2357 Glacier St
- 2259 Glacier St
- 2162 Glacier St
- 2156 Glacier St
- 2159 Yellowstone Blvd
- 2149 Yellowstone Blvd
- 867 Lansing Ct Unit 165
- 869 Lansing Ct Unit 167
- 871 Lansing Ct Unit 166
- 873 Lansing Ct Unit 164
- 875 Lansing Ct Unit 161
- 877 Lansing Ct Unit 163
- 879 Lansing Ct Unit 162
- 879 Lansing Ct Unit 1
- 872 Sparta Ct Unit 72
- 874 Sparta Ct Unit 82
- 876 Sparta Ct Unit 83
- 876 Sparta Ct Unit 876
- 870 Sparta Ct Unit 73
- 878 Sparta Ct Unit 81
- 880 Sparta Ct Unit 84
- 876 Lansing Ct Unit 152
- 874 Lansing Ct Unit 153
- 725 Grosse Pointe Cir Unit 184
- 866 Sparta Ct Unit 74
- 727 Grosse Pointe Cir Unit 181