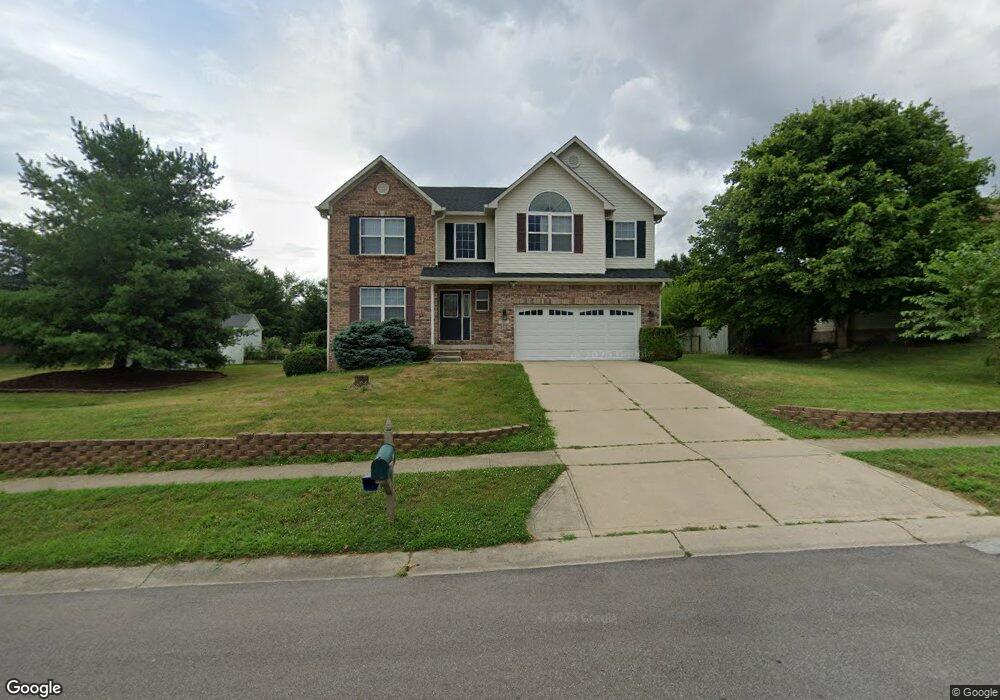
867 N Shore Blvd Franklin, IN 46131
Estimated Value: $353,000 - $379,085
5
Beds
3
Baths
3,452
Sq Ft
$106/Sq Ft
Est. Value
About This Home
This home is located at 867 N Shore Blvd, Franklin, IN 46131 and is currently estimated at $365,271, approximately $105 per square foot. 867 N Shore Blvd is a home located in Johnson County with nearby schools including Creekside Elementary School, Franklin Community Middle School, and Custer Baker Intermediate School.
Ownership History
Date
Name
Owned For
Owner Type
Purchase Details
Closed on
Aug 27, 2010
Sold by
Nguyen Bao Thien
Bought by
Nguyen Bao Thien and Tran Nga Thi Ngoc
Current Estimated Value
Purchase Details
Closed on
Apr 28, 2010
Sold by
Sirva Relocation Credit Llc
Bought by
Nguyen Bao Thien
Home Financials for this Owner
Home Financials are based on the most recent Mortgage that was taken out on this home.
Original Mortgage
$156,000
Interest Rate
4.83%
Mortgage Type
New Conventional
Purchase Details
Closed on
Apr 27, 2010
Sold by
Musgrave James K and Musgrave Cynthia K
Bought by
Sirva Relocation Credit Llc
Home Financials for this Owner
Home Financials are based on the most recent Mortgage that was taken out on this home.
Original Mortgage
$156,000
Interest Rate
4.83%
Mortgage Type
New Conventional
Create a Home Valuation Report for This Property
The Home Valuation Report is an in-depth analysis detailing your home's value as well as a comparison with similar homes in the area
Home Values in the Area
Average Home Value in this Area
Purchase History
| Date | Buyer | Sale Price | Title Company |
|---|---|---|---|
| Nguyen Bao Thien | -- | None Available | |
| Nguyen Bao Thien | -- | Stewart Title Guaranty Compa | |
| Sirva Relocation Credit Llc | -- | None Available |
Source: Public Records
Mortgage History
| Date | Status | Borrower | Loan Amount |
|---|---|---|---|
| Previous Owner | Sirva Relocation Credit Llc | $156,000 |
Source: Public Records
Tax History Compared to Growth
Tax History
| Year | Tax Paid | Tax Assessment Tax Assessment Total Assessment is a certain percentage of the fair market value that is determined by local assessors to be the total taxable value of land and additions on the property. | Land | Improvement |
|---|---|---|---|---|
| 2025 | $6,861 | $342,200 | $28,800 | $313,400 |
| 2024 | $6,861 | $310,000 | $28,800 | $281,200 |
| 2023 | $6,431 | $275,100 | $28,800 | $246,300 |
| 2022 | $5,960 | $267,100 | $28,800 | $238,300 |
| 2021 | $5,489 | $245,900 | $28,800 | $217,100 |
| 2020 | $5,549 | $248,600 | $28,800 | $219,800 |
| 2019 | $5,506 | $246,700 | $27,700 | $219,000 |
| 2018 | $2,266 | $228,600 | $27,700 | $200,900 |
| 2017 | $2,236 | $222,600 | $27,700 | $194,900 |
| 2016 | $1,967 | $209,500 | $27,700 | $181,800 |
| 2014 | $1,947 | $196,000 | $31,900 | $164,100 |
| 2013 | $1,947 | $194,300 | $31,900 | $162,400 |
Source: Public Records
Map
Nearby Homes
- 907 Ram Dr
- Ironwood Plan at Bluffs at Young's Creek
- Juniper Plan at Bluffs at Young's Creek
- Norway Plan at Bluffs at Young's Creek
- Bradford Plan at Bluffs at Young's Creek
- Ashton Plan at Bluffs at Young's Creek
- Aspen II Plan at Bluffs at Young's Creek
- Palmetto Plan at Bluffs at Young's Creek
- Cooper Plan at Bluffs at Young's Creek
- Chestnut Plan at Bluffs at Young's Creek
- Empress Plan at Bluffs at Young's Creek
- Spruce Plan at Bluffs at Young's Creek
- 945 Aries Blvd
- 772 Franklin Lakes Blvd
- 785 Shoreline Ct
- 6516 N U S Highway 31
- 1009 Foxtail Dr
- 1157 Supernova Dr
- 252 S Main St
- 949 Borealis Dr