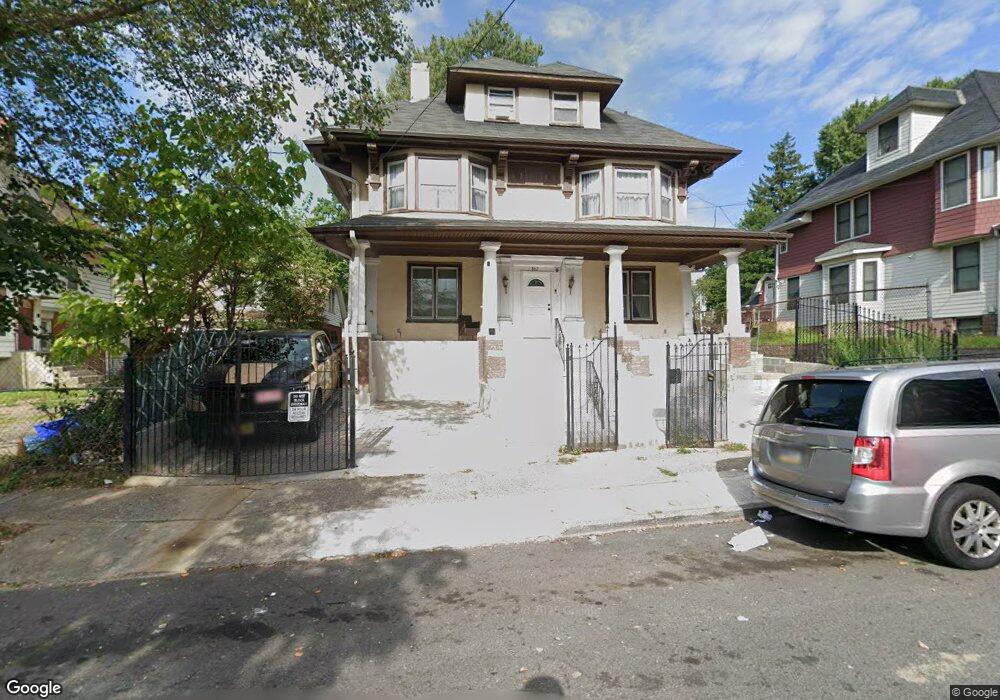
867 S 11th St Unit 869 Newark, NJ 07108
Clinton Hill NeighborhoodEstimated Value: $352,000 - $654,000
--
Bed
--
Bath
3,208
Sq Ft
$165/Sq Ft
Est. Value
About This Home
This home is located at 867 S 11th St Unit 869, Newark, NJ 07108 and is currently estimated at $529,824, approximately $165 per square foot. 867 S 11th St Unit 869 is a home located in Essex County with nearby schools including Hawthorne Avenue Elementary School, Belmont Runyon School, and Louise A. Spencer School.
Ownership History
Date
Name
Owned For
Owner Type
Purchase Details
Closed on
Nov 16, 2015
Sold by
Pirotto Osvaldo
Bought by
Hugran Saleh H
Current Estimated Value
Purchase Details
Closed on
Mar 24, 2014
Bought by
Pirotto Osvaldo
Purchase Details
Closed on
Aug 16, 2013
Sold by
Us Bank Na As Legal Trustee For Lvs Titl
Bought by
Baker Jeffrey and Baker Keith
Purchase Details
Closed on
Dec 7, 2007
Sold by
Cook Ruth
Bought by
Lind Patrick
Home Financials for this Owner
Home Financials are based on the most recent Mortgage that was taken out on this home.
Original Mortgage
$240,000
Interest Rate
6.3%
Mortgage Type
Unknown
Purchase Details
Closed on
Jul 10, 2007
Sold by
Butler Wilbur
Bought by
Butler Wilbur
Purchase Details
Closed on
Feb 2, 1993
Sold by
City Of Newark
Bought by
Cook Cook R and Cook Baker,A
Create a Home Valuation Report for This Property
The Home Valuation Report is an in-depth analysis detailing your home's value as well as a comparison with similar homes in the area
Home Values in the Area
Average Home Value in this Area
Purchase History
| Date | Buyer | Sale Price | Title Company |
|---|---|---|---|
| Hugran Saleh H | $150,000 | -- | |
| Pirotto Osvaldo | $51,000 | -- | |
| Pirotto Osvaldo | -- | None Available | |
| Baker Jeffrey | -- | None Available | |
| Lind Patrick | $300,000 | Woodbury Title Agency Llc | |
| Butler Wilbur | -- | None Available | |
| Cook Cook R | -- | -- |
Source: Public Records
Mortgage History
| Date | Status | Borrower | Loan Amount |
|---|---|---|---|
| Previous Owner | Lind Patrick | $240,000 | |
| Closed | Baker Jeffrey | -- |
Source: Public Records
Tax History Compared to Growth
Tax History
| Year | Tax Paid | Tax Assessment Tax Assessment Total Assessment is a certain percentage of the fair market value that is determined by local assessors to be the total taxable value of land and additions on the property. | Land | Improvement |
|---|---|---|---|---|
| 2025 | $5,428 | $145,600 | $14,100 | $131,500 |
| 2024 | $5,428 | $145,600 | $14,100 | $131,500 |
| 2022 | $5,440 | $145,600 | $14,100 | $131,500 |
| 2021 | $5,437 | $145,600 | $14,100 | $131,500 |
| 2020 | $5,533 | $145,600 | $14,100 | $131,500 |
| 2019 | $5,476 | $145,600 | $14,100 | $131,500 |
| 2018 | $5,377 | $145,600 | $14,100 | $131,500 |
| 2017 | $5,895 | $165,600 | $14,100 | $151,500 |
| 2016 | $5,697 | $165,600 | $14,100 | $151,500 |
| 2015 | $5,480 | $165,600 | $14,100 | $151,500 |
| 2014 | $5,135 | $165,600 | $14,100 | $151,500 |
Source: Public Records
Map
Nearby Homes
- 689 Clinton Ave
- 827 S 11th St Unit 829
- 33 Vernon Ave
- 35-37 Vernon Ave
- 37 Vernon Ave
- 16 Ingraham Place Unit 20
- 824-826 S 13th St
- 42 Nairn Place Unit 44
- 847 S 14th St
- 811 S 13th St
- 835 S 14th St
- 832 S 15th St
- 820 S 15th St
- 24 Girard Place
- 896-898 S 16th St
- 783 S 13th St
- 783 S 13th St Unit 2
- 35 Randolph Place
- 867-869 S 11th St
- 861 S 11th St Unit 865
- 667-671 Clinton Ave
- 667 Clinton Ave Unit 671
- 858 S 12th St Unit 860
- 673 Clinton Ave Unit 675
- 852 S 12th St Unit 856
- 855-859 S 11th St
- 846 S 12th St Unit 850
- 673-675 Clinton Ave
- 649-659 Clinton Ave
- 649 Clinton Ave Unit ST1-9
- 649 Clinton Ave Unit ST4
- 649 Clinton Ave
- 655 Clinton Ave
- 849-853 S 11th St
- 856 S 11th St Unit 858
- 842 S 12th St Unit 844
- 852-854 S 11th St
- 838 S 12th St Unit 840