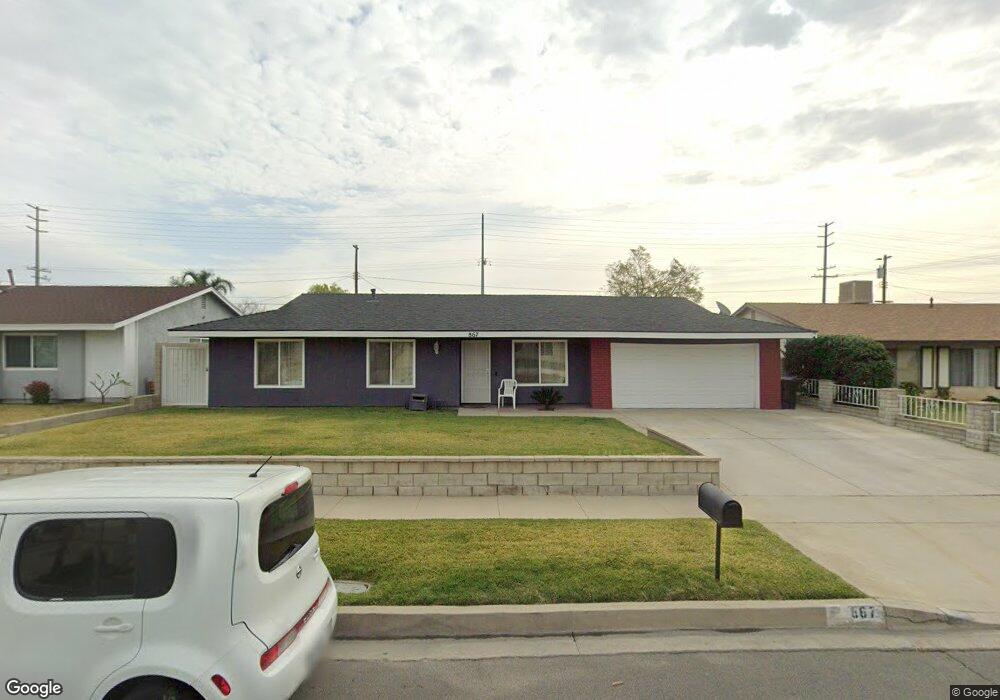
867 S Ironwood Ave Bloomington, CA 92316
Estimated Value: $517,000 - $639,000
3
Beds
2
Baths
1,492
Sq Ft
$381/Sq Ft
Est. Value
About This Home
This home is located at 867 S Ironwood Ave, Bloomington, CA 92316 and is currently estimated at $568,115, approximately $380 per square foot. 867 S Ironwood Ave is a home located in San Bernardino County with nearby schools including Maple Elementary School, Alder Middle School, and Jurupa Hills High School.
Ownership History
Date
Name
Owned For
Owner Type
Purchase Details
Closed on
Aug 9, 2011
Sold by
Moore Jesse
Bought by
Fuentes William and Orozco Martha C
Current Estimated Value
Home Financials for this Owner
Home Financials are based on the most recent Mortgage that was taken out on this home.
Original Mortgage
$146,197
Interest Rate
4.15%
Mortgage Type
FHA
Purchase Details
Closed on
Nov 28, 1994
Sold by
Engles Charles R
Bought by
Moore Jesse and Gallon Acie D
Home Financials for this Owner
Home Financials are based on the most recent Mortgage that was taken out on this home.
Original Mortgage
$96,728
Interest Rate
8.9%
Mortgage Type
FHA
Purchase Details
Closed on
Jan 17, 1994
Sold by
Mcginn Laura and Sherman Laura
Bought by
Engles Charles R
Purchase Details
Closed on
Jan 15, 1994
Sold by
Engles Charles
Bought by
Engles Charles R
Create a Home Valuation Report for This Property
The Home Valuation Report is an in-depth analysis detailing your home's value as well as a comparison with similar homes in the area
Home Values in the Area
Average Home Value in this Area
Purchase History
| Date | Buyer | Sale Price | Title Company |
|---|---|---|---|
| Fuentes William | $150,000 | Chicago Title Company | |
| Moore Jesse | -- | Chicago Title Company | |
| Moore Jesse | $97,000 | Fidelity National Title Ins | |
| Engles Charles R | -- | Fidelity National Title | |
| Engles Charles R | -- | Fidelity National Title |
Source: Public Records
Mortgage History
| Date | Status | Borrower | Loan Amount |
|---|---|---|---|
| Previous Owner | Fuentes William | $146,197 | |
| Previous Owner | Moore Jesse | $96,728 |
Source: Public Records
Tax History Compared to Growth
Tax History
| Year | Tax Paid | Tax Assessment Tax Assessment Total Assessment is a certain percentage of the fair market value that is determined by local assessors to be the total taxable value of land and additions on the property. | Land | Improvement |
|---|---|---|---|---|
| 2025 | $2,396 | $188,409 | $50,243 | $138,166 |
| 2024 | $2,396 | $184,715 | $49,258 | $135,457 |
| 2023 | $2,346 | $181,093 | $48,292 | $132,801 |
| 2022 | $2,301 | $177,542 | $47,345 | $130,197 |
| 2021 | $2,278 | $174,061 | $46,417 | $127,644 |
| 2020 | $2,263 | $172,276 | $45,941 | $126,335 |
| 2019 | $2,206 | $168,898 | $45,040 | $123,858 |
| 2018 | $2,212 | $165,586 | $44,157 | $121,429 |
| 2017 | $2,202 | $162,339 | $43,291 | $119,048 |
| 2016 | $1,833 | $159,156 | $42,442 | $116,714 |
| 2015 | $1,810 | $156,765 | $41,804 | $114,961 |
| 2014 | $1,811 | $153,694 | $40,985 | $112,709 |
Source: Public Records
Map
Nearby Homes
- 806 S Sandalwood Ave
- 1560 W Athol St
- 1459 W James St
- 18264 Pine Ave Unit a & B
- 18264 Pine Ave
- 9050 Dumond Dr
- 1510 W Merrill Ave
- 1228 W Woodcrest St
- 1157 W Orchard St
- 9562 Locust Ave
- 1028 W Woodcrest St
- 9824 Linden Ave
- 9971 Cedar Ave
- 9649 Grace St
- 18325 El Molino St
- 8795 Frankfort St
- 18239 Orange Way
- 17962 Merrill Ave
- 1154 S Spruce Ave
- 9967 Cedar Ave
- 877 S Ironwood Ave
- 857 S Ironwood Ave
- 868 S Linden Ave
- 858 S Linden Ave
- 878 S Linden Ave
- 847 S Ironwood Ave
- 887 S Ironwood Ave
- 868 S Ironwood Ave
- 848 S Linden Ave
- 858 S Ironwood Ave
- 878 S Ironwood Ave
- 888 S Linden Ave
- 1527 Pinedale Ave
- 848 S Ironwood Ave
- 888 S Ironwood Ave
- 1515 Pinedale Ave
- 867 S Sandalwood Ave
- 1553 Pinedale Ave
- 877 S Sandalwood Ave
- 857 S Sandalwood Ave