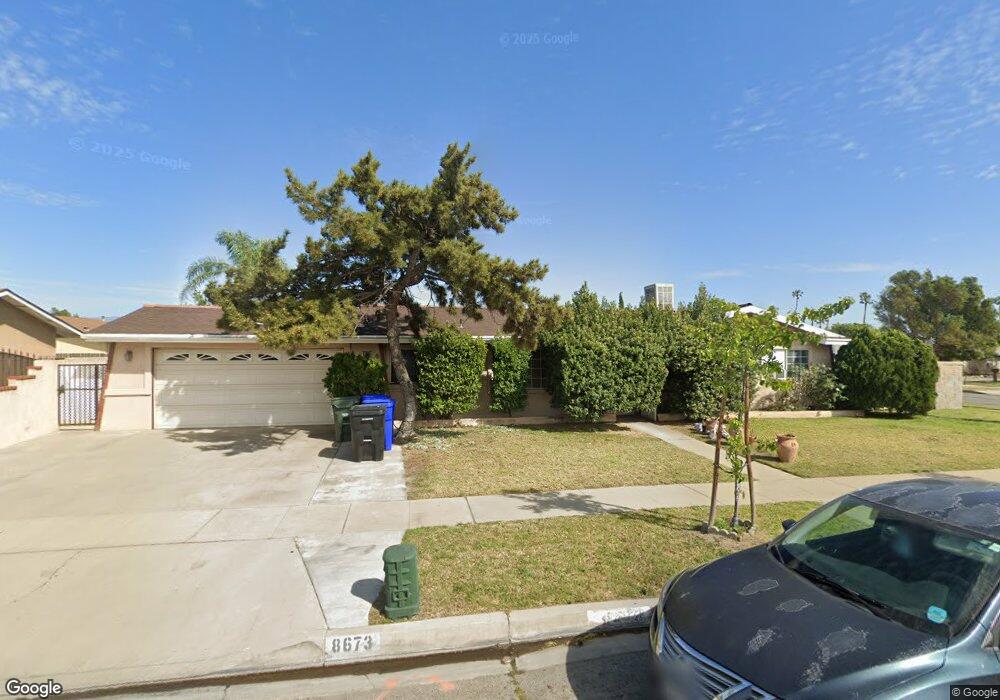
8673 Encina Ave Fontana, CA 92335
Estimated Value: $543,000 - $609,000
4
Beds
3
Baths
1,696
Sq Ft
$341/Sq Ft
Est. Value
About This Home
This home is located at 8673 Encina Ave, Fontana, CA 92335 and is currently estimated at $579,033, approximately $341 per square foot. 8673 Encina Ave is a home located in San Bernardino County with nearby schools including South Tamarind Elementary School, Fontana Middle School, and Fontana High School.
Ownership History
Date
Name
Owned For
Owner Type
Purchase Details
Closed on
Feb 12, 2001
Sold by
Quinonez Tomas and Quinonez Sandra
Bought by
Quinonez Tomas and Quinonez Sandra A
Current Estimated Value
Home Financials for this Owner
Home Financials are based on the most recent Mortgage that was taken out on this home.
Original Mortgage
$83,000
Interest Rate
6.89%
Purchase Details
Closed on
Apr 18, 1995
Sold by
Hud
Bought by
Quinonez Tomas and Quinonez Sandra
Home Financials for this Owner
Home Financials are based on the most recent Mortgage that was taken out on this home.
Original Mortgage
$83,436
Interest Rate
8.51%
Mortgage Type
FHA
Purchase Details
Closed on
Nov 11, 1994
Sold by
Fleet Mtg Corp
Bought by
Hud
Create a Home Valuation Report for This Property
The Home Valuation Report is an in-depth analysis detailing your home's value as well as a comparison with similar homes in the area
Home Values in the Area
Average Home Value in this Area
Purchase History
| Date | Buyer | Sale Price | Title Company |
|---|---|---|---|
| Quinonez Tomas | -- | Ati Title Company | |
| Quinonez Tomas | $85,000 | World Title | |
| Hud | -- | Fidelity National Title Ins | |
| Fleet Mtg Corp | $144,845 | Fidelity National Title Ins |
Source: Public Records
Mortgage History
| Date | Status | Borrower | Loan Amount |
|---|---|---|---|
| Closed | Quinonez Tomas | $83,000 | |
| Closed | Quinonez Tomas | $83,436 |
Source: Public Records
Tax History Compared to Growth
Tax History
| Year | Tax Paid | Tax Assessment Tax Assessment Total Assessment is a certain percentage of the fair market value that is determined by local assessors to be the total taxable value of land and additions on the property. | Land | Improvement |
|---|---|---|---|---|
| 2025 | $2,295 | $185,619 | $50,391 | $135,228 |
| 2024 | $2,295 | $181,979 | $49,403 | $132,576 |
| 2023 | $1,811 | $178,410 | $48,434 | $129,976 |
| 2022 | $1,802 | $174,911 | $47,484 | $127,427 |
| 2021 | $1,778 | $171,481 | $46,553 | $124,928 |
| 2020 | $1,773 | $169,723 | $46,076 | $123,647 |
| 2019 | $1,733 | $166,396 | $45,173 | $121,223 |
| 2018 | $1,820 | $163,133 | $44,287 | $118,846 |
| 2017 | $1,558 | $137,492 | $43,419 | $94,073 |
| 2016 | $1,532 | $134,796 | $42,568 | $92,228 |
| 2015 | $1,513 | $132,772 | $41,929 | $90,843 |
| 2014 | $1,514 | $130,172 | $41,108 | $89,064 |
Source: Public Records
Map
Nearby Homes
- 17425 Arrow Blvd Unit 8
- 17626 Orange Ct
- 17232 Ceres Ave
- 8937 Palmetto Ave
- 17394 Seville Ct
- 8870 Blanchard Ave
- Newbridge Plan at Summit Park - Paloma
- Niagra Plan at Summit Park - Paloma
- Nigel Plan at Summit Park - Paloma
- Ballard Plan at Summit Park - Aurora
- Barbara Plan at Summit Park - Aurora
- Bastian Plan at Summit Park - Aurora
- 17379 Orchid Dr
- 17425 Upland Ave
- 8939 Mango Ave Unit F
- 18276 Arrow Blvd
- 17721 Upland Ave
- 17391 Athol St
- 8998 Mango Ave Unit H
- 17442 Vine St
- 17440 Orange Way
- 8663 Encina Ave
- 17451 Dorsey Ct
- 17450 Orange Way
- 8676 Encina Ave
- 8666 Encina Ave
- 17461 Dorsey Ct
- 17441 Orange Way
- 17435 Orange Way
- 17435 Orange Way
- 8684 Encina Ave
- 8656 Encina Ave
- 17460 Orange Way
- 17461 Orange Way
- 8646 Encina Ave
- 17471 Dorsey Ct
- 8679 Palo Verde Ave
- 17440 Dorsey Ct
- 8669 Palo Verde Ave