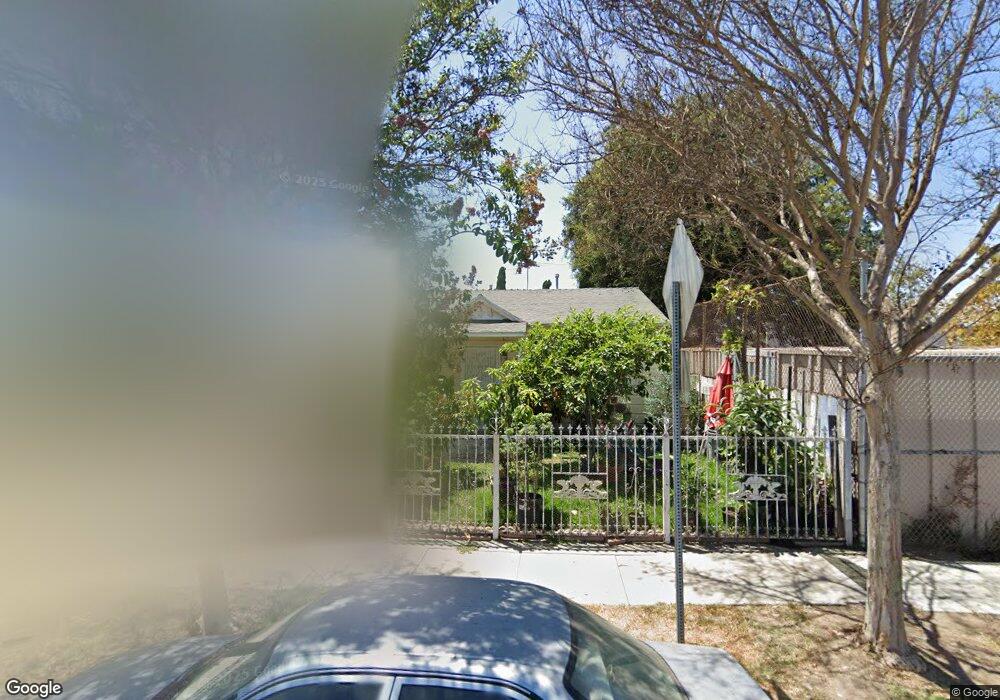
8673 San Juan Ave South Gate, CA 90280
Estimated Value: $644,000 - $684,000
3
Beds
2
Baths
1,001
Sq Ft
$659/Sq Ft
Est. Value
About This Home
This home is located at 8673 San Juan Ave, South Gate, CA 90280 and is currently estimated at $659,851, approximately $659 per square foot. 8673 San Juan Ave is a home located in Los Angeles County with nearby schools including San Gabriel Avenue Elementary School, South Gate Middle School, and Southeast Middle School.
Ownership History
Date
Name
Owned For
Owner Type
Purchase Details
Closed on
Nov 22, 2000
Sold by
Hud
Bought by
Lopez Efrain and Garibaldo Martha Lopez
Current Estimated Value
Home Financials for this Owner
Home Financials are based on the most recent Mortgage that was taken out on this home.
Original Mortgage
$137,837
Interest Rate
7.54%
Mortgage Type
FHA
Purchase Details
Closed on
Aug 25, 2000
Sold by
Wells Fargo Home Mtg Inc
Bought by
Hud
Purchase Details
Closed on
Jun 22, 2000
Sold by
Guzman Martha L
Bought by
Wells Fargo Home Mtg Inc and Norwest Mtg Inc
Purchase Details
Closed on
Dec 7, 1999
Sold by
Guzman Martha L
Bought by
Hoover Associates
Purchase Details
Closed on
Apr 11, 1996
Sold by
Esparza Mike
Bought by
Guzman Martha L and Rangel Norma
Home Financials for this Owner
Home Financials are based on the most recent Mortgage that was taken out on this home.
Original Mortgage
$145,348
Interest Rate
7.41%
Mortgage Type
FHA
Create a Home Valuation Report for This Property
The Home Valuation Report is an in-depth analysis detailing your home's value as well as a comparison with similar homes in the area
Home Values in the Area
Average Home Value in this Area
Purchase History
| Date | Buyer | Sale Price | Title Company |
|---|---|---|---|
| Lopez Efrain | $140,000 | Provident Title | |
| Hud | -- | First American Title Ins Co | |
| Wells Fargo Home Mtg Inc | $162,887 | First American Title Ins Co | |
| Hoover Associates | $1,000 | -- | |
| Guzman Martha L | $148,000 | Chicago Title |
Source: Public Records
Mortgage History
| Date | Status | Borrower | Loan Amount |
|---|---|---|---|
| Previous Owner | Lopez Efrain | $137,837 | |
| Previous Owner | Guzman Martha L | $145,348 |
Source: Public Records
Tax History Compared to Growth
Tax History
| Year | Tax Paid | Tax Assessment Tax Assessment Total Assessment is a certain percentage of the fair market value that is determined by local assessors to be the total taxable value of land and additions on the property. | Land | Improvement |
|---|---|---|---|---|
| 2025 | $3,050 | $210,935 | $160,167 | $50,768 |
| 2024 | $3,050 | $206,800 | $157,027 | $49,773 |
| 2023 | $3,001 | $202,747 | $153,949 | $48,798 |
| 2022 | $2,867 | $198,773 | $150,931 | $47,842 |
| 2021 | $2,832 | $194,876 | $147,972 | $46,904 |
| 2019 | $2,747 | $189,098 | $143,584 | $45,514 |
| 2018 | $2,645 | $185,391 | $140,769 | $44,622 |
| 2016 | $2,524 | $178,194 | $135,303 | $42,891 |
| 2015 | $2,484 | $175,518 | $133,271 | $42,247 |
| 2014 | $2,487 | $172,081 | $130,661 | $41,420 |
Source: Public Records
Map
Nearby Homes
- 8686 San Juan Ave
- 8669 San Gabriel Ave
- 8945 San Antonio Ave
- 3816 Liberty Blvd
- 9307 San Miguel Ave
- 9222 California Ave
- 8963 Bowman Ave
- 9529 San Juan Ave
- 9601 San Juan Ave
- 9308 Mcnerney Ave
- 8991 Victoria Ave
- 9219 Alexander Ave
- 9611 Mallison Ave
- 9528 Mcnerney Ave
- 9643 Mallison Ave
- 9525 Bowman Ave
- 4006 Broadway
- 9714 Otis St
- 9718 Otis St
- 9616 Bowman Ave
- 8677 San Juan Ave
- 8681 San Juan Ave
- 8685 San Juan Ave
- 8689 San Juan Ave
- 8680 San Gabriel Ave
- 8686 San Gabriel Ave
- 8672 San Juan Ave
- 8676 San Juan Ave
- 8668 San Juan Ave
- 8680 San Juan Ave
- 8664 San Juan Ave
- 8660 San Juan Ave
- 8690 San Juan Ave
- 8656 San Juan Ave
- 8694 San Juan Ave
- 8652 San Juan Ave
- 8648 San Juan Ave
- 8644 San Juan Ave
- 8675 San Gabriel Ave
- 8673 San Luis Ave