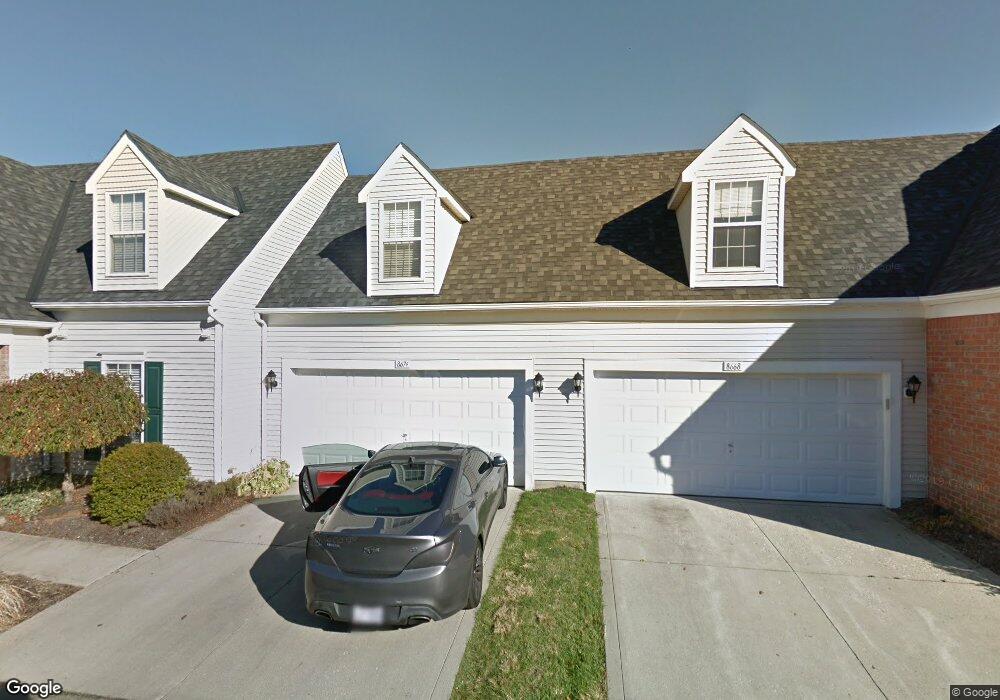
8674 Lazelle Commons Dr Unit T8674 Lewis Center, OH 43035
Olentangy NeighborhoodEstimated Value: $386,448 - $404,000
3
Beds
3
Baths
2,236
Sq Ft
$177/Sq Ft
Est. Value
About This Home
This home is located at 8674 Lazelle Commons Dr Unit T8674, Lewis Center, OH 43035 and is currently estimated at $395,862, approximately $177 per square foot. 8674 Lazelle Commons Dr Unit T8674 is a home located in Delaware County with nearby schools including Olentangy Meadows Elementary School, Olentangy Orange Middle School, and Orange High School.
Ownership History
Date
Name
Owned For
Owner Type
Purchase Details
Closed on
Oct 5, 2017
Sold by
Beck Lori L
Bought by
Elliot Thomas J
Current Estimated Value
Purchase Details
Closed on
Feb 23, 2007
Sold by
Shoemaker Lori A and Brudzinski Lori A
Bought by
Beck Lori L
Home Financials for this Owner
Home Financials are based on the most recent Mortgage that was taken out on this home.
Original Mortgage
$151,000
Interest Rate
6.27%
Mortgage Type
Purchase Money Mortgage
Purchase Details
Closed on
Dec 4, 2000
Sold by
Elan Communities Ltd
Bought by
Brudzinski Lori A
Home Financials for this Owner
Home Financials are based on the most recent Mortgage that was taken out on this home.
Original Mortgage
$179,600
Interest Rate
7.86%
Mortgage Type
FHA
Create a Home Valuation Report for This Property
The Home Valuation Report is an in-depth analysis detailing your home's value as well as a comparison with similar homes in the area
Home Values in the Area
Average Home Value in this Area
Purchase History
| Date | Buyer | Sale Price | Title Company |
|---|---|---|---|
| Elliot Thomas J | -- | -- | |
| Beck Lori L | $201,000 | Talon Group | |
| Brudzinski Lori A | $185,168 | -- |
Source: Public Records
Mortgage History
| Date | Status | Borrower | Loan Amount |
|---|---|---|---|
| Previous Owner | Beck Lori L | $151,000 | |
| Previous Owner | Brudzinski Lori A | $179,600 |
Source: Public Records
Tax History Compared to Growth
Tax History
| Year | Tax Paid | Tax Assessment Tax Assessment Total Assessment is a certain percentage of the fair market value that is determined by local assessors to be the total taxable value of land and additions on the property. | Land | Improvement |
|---|---|---|---|---|
| 2024 | $5,019 | $103,180 | $21,350 | $81,830 |
| 2023 | $5,040 | $103,180 | $21,350 | $81,830 |
| 2022 | $4,908 | $80,010 | $16,800 | $63,210 |
| 2021 | $4,936 | $80,010 | $16,800 | $63,210 |
| 2020 | $4,963 | $80,010 | $16,800 | $63,210 |
| 2019 | $3,706 | $63,000 | $14,000 | $49,000 |
| 2018 | $3,723 | $63,000 | $14,000 | $49,000 |
| 2017 | $3,464 | $57,750 | $10,500 | $47,250 |
| 2016 | $3,621 | $57,750 | $10,500 | $47,250 |
| 2015 | $3,249 | $57,750 | $10,500 | $47,250 |
| 2014 | $3,298 | $57,750 | $10,500 | $47,250 |
| 2013 | $3,679 | $63,000 | $10,500 | $52,500 |
Source: Public Records
Map
Nearby Homes
- 294 Lazelle Place Ln Unit Q294
- 8747 Olenbrook Dr
- 8750 Woodwind Dr
- 8749 Olenmead Dr
- 8824 Rock Dove Rd
- 45 Gold Meadow Dr
- 687 Sanville Dr
- 128 Green Springs Dr
- 9002 Newmills Ln
- 8326 Bruntsfield Rd
- 365 Cover Place
- 9123 Parkbury Ln Unit 9123
- 758 Parkgrove Way Unit 758
- 9170 Parkbury Ln
- 90 Northwoods Blvd Unit B
- 67 Highland Pointe Cir Unit 67
- 7981 Oakwind Ct
- 164 Cameron Ridge Dr Unit 164
- 889 Pelham Ct
- 8910 Sedona Ct
- 8680 Lazelle Commons Dr
- 8675 Lazelle Commons Dr Unit 8675
- 8668 Lazelle Commons Dr
- 8669 Lazelle Commons Dr Unit 8669
- 8663 Lazelle Commons Dr
- 8662 Lazelle Commons Dr
- 8681 Lazelle Commons Dr Unit 8681
- 8689 Lazelle Village Dr
- 8704 Lazelle Commons Dr Unit S8701
- 8657 Lazelle Commons Dr
- 8683 Lazelle Village Dr Unit 8683
- 8687 Lazelle Commons Dr Unit 8687
- 8695 Lazelle Village Dr Unit 8695
- 8710 Lazelle Commons Dr
- 8677 Lazelle Village Dr
- 8656 Lazelle Commons Dr
- 8620 Olenbrook Dr
- 8626 Olenbrook Dr
- 8693 Lazelle Commons Dr Unit 8693
- 8614 Olenbrook Dr