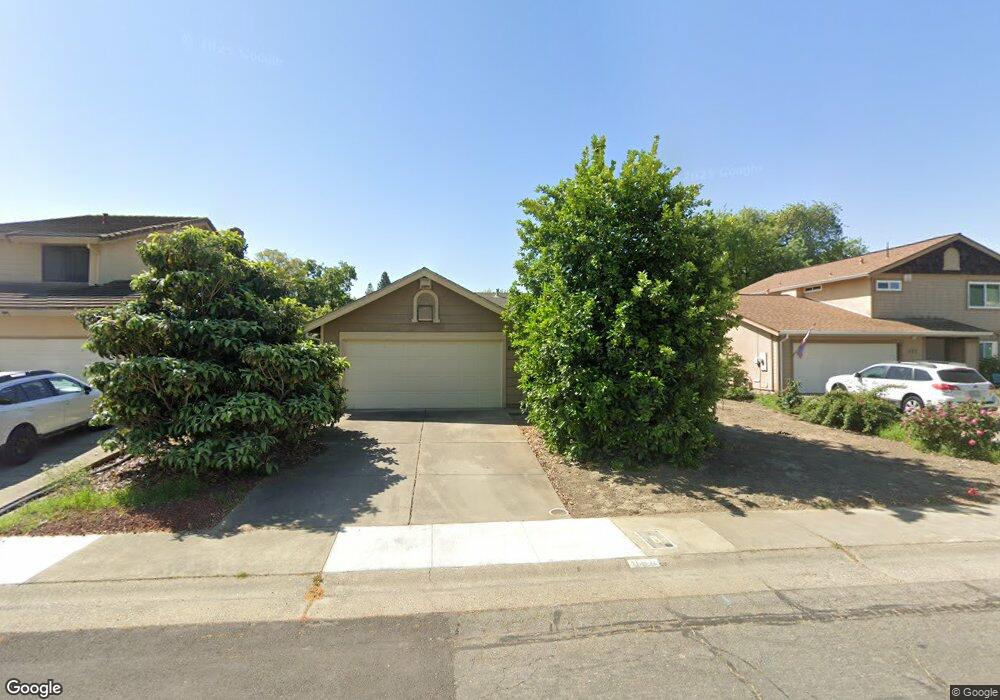
868 Shellwood Way Sacramento, CA 95831
Pocket-Greenhaven NeighborhoodEstimated Value: $563,000 - $593,365
4
Beds
2
Baths
1,555
Sq Ft
$374/Sq Ft
Est. Value
About This Home
This home is located at 868 Shellwood Way, Sacramento, CA 95831 and is currently estimated at $582,341, approximately $374 per square foot. 868 Shellwood Way is a home located in Sacramento County with nearby schools including Martin Luther King, Jr School, Sam Brannan Middle School, and John F. Kennedy High School.
Ownership History
Date
Name
Owned For
Owner Type
Purchase Details
Closed on
Jan 29, 2007
Sold by
Wong Jake Hung Kuk
Bought by
Wong Gook S
Current Estimated Value
Home Financials for this Owner
Home Financials are based on the most recent Mortgage that was taken out on this home.
Original Mortgage
$220,000
Outstanding Balance
$131,331
Interest Rate
6.1%
Mortgage Type
Purchase Money Mortgage
Estimated Equity
$451,010
Purchase Details
Closed on
Oct 31, 2002
Sold by
Mcmurty Addison L
Bought by
Wong Jake Hung Kuk
Home Financials for this Owner
Home Financials are based on the most recent Mortgage that was taken out on this home.
Original Mortgage
$198,400
Interest Rate
6.5%
Purchase Details
Closed on
Mar 26, 1996
Sold by
Pearce John S and Dickinson Kathleen L
Bought by
Mcmurtry Addison L
Home Financials for this Owner
Home Financials are based on the most recent Mortgage that was taken out on this home.
Original Mortgage
$132,822
Interest Rate
6.98%
Create a Home Valuation Report for This Property
The Home Valuation Report is an in-depth analysis detailing your home's value as well as a comparison with similar homes in the area
Home Values in the Area
Average Home Value in this Area
Purchase History
| Date | Buyer | Sale Price | Title Company |
|---|---|---|---|
| Wong Gook S | $250,000 | Placer Title Company | |
| Wong Jake Hung Kuk | $248,000 | North American Title Company | |
| Mcmurtry Addison L | $135,000 | Stewart Title |
Source: Public Records
Mortgage History
| Date | Status | Borrower | Loan Amount |
|---|---|---|---|
| Open | Wong Gook S | $220,000 | |
| Previous Owner | Wong Jake Hung Kuk | $198,400 | |
| Previous Owner | Mcmurtry Addison L | $132,822 | |
| Closed | Wong Jake Hung Kuk | $37,200 |
Source: Public Records
Tax History Compared to Growth
Tax History
| Year | Tax Paid | Tax Assessment Tax Assessment Total Assessment is a certain percentage of the fair market value that is determined by local assessors to be the total taxable value of land and additions on the property. | Land | Improvement |
|---|---|---|---|---|
| 2025 | $5,925 | $495,704 | $167,464 | $328,240 |
| 2024 | $5,925 | $485,985 | $164,181 | $321,804 |
| 2023 | $5,778 | $476,457 | $160,962 | $315,495 |
| 2022 | $5,695 | $467,115 | $157,806 | $309,309 |
| 2021 | $5,421 | $457,957 | $154,712 | $303,245 |
| 2020 | $5,246 | $434,473 | $158,749 | $275,724 |
| 2019 | $4,973 | $411,823 | $150,473 | $261,350 |
| 2018 | $4,672 | $388,513 | $141,956 | $246,557 |
| 2017 | $4,440 | $366,522 | $133,921 | $232,601 |
| 2016 | $4,136 | $342,545 | $125,160 | $217,385 |
| 2015 | $3,840 | $317,172 | $115,889 | $201,283 |
| 2014 | $3,710 | $307,934 | $112,514 | $195,420 |
Source: Public Records
Map
Nearby Homes
- 1053 L Aloutte Way
- 1100 La Fleur Way
- 7455 Summerwind Way
- 7170 Westmoreland Way
- 7110 Westmoreland Way
- 1210 Cedar Tree Way
- 7400 Mooncrest Way
- 7717 E Port Dr
- 7332 Idle Wild Way
- 943 Shore Breeze Dr
- 7341 Stanwood Way
- 7036 13th St
- 7048 13th St
- 7441 Spicewood Dr
- 8055 Linda Isle Ln
- 6874 Westmoreland Way
- 1312 58th Ave
- 7701 Sleepy River Way
- 977 Coleman Ranch Way
- 1416 Lomas Way
- 864 Shellwood Way
- 872 Shellwood Way
- 7401 Rio Mondego Dr
- 876 Shellwood Way
- 860 Shellwood Way
- 869 Shellwood Way
- 7405 Rio Mondego Dr
- 865 Shellwood Way
- 7400 Rio Mondego Dr
- 873 Shellwood Way
- 856 Shellwood Way
- 880 Shellwood Way
- 17 Terra Alta Ct
- 877 Shellwood Way
- 7404 Rio Mondego Dr
- 852 Shellwood Way
- 7508 S Land Park Dr
- 7409 Rio Mondego Dr
- 15 Mossbeach Ct
- 9 Terra Alta Ct