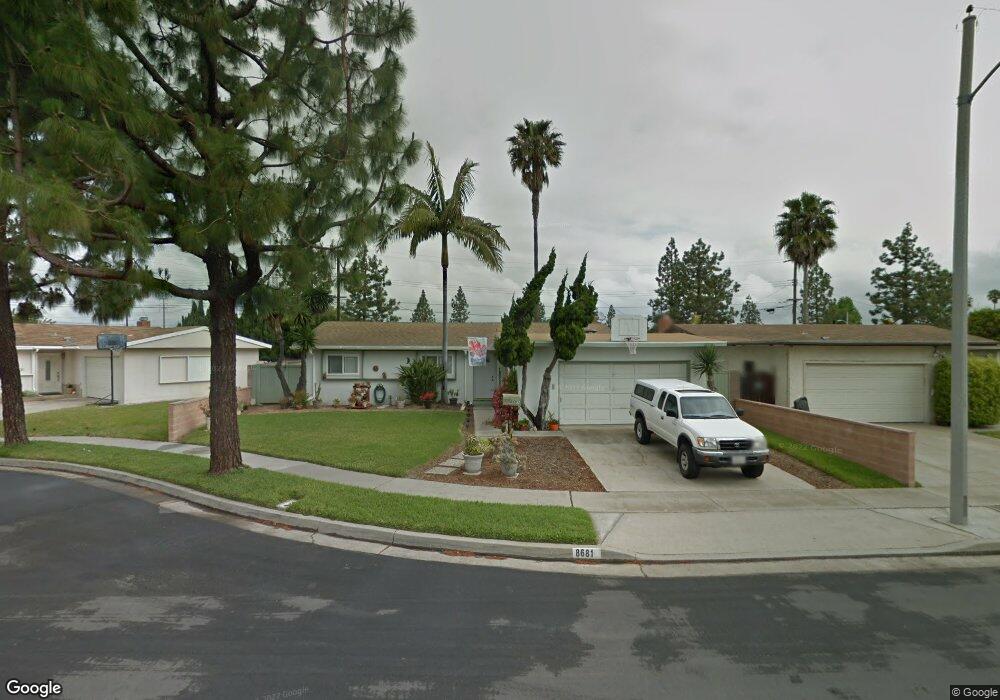
8681 Royer Cir Huntington Beach, CA 92647
Estimated Value: $1,004,000 - $1,310,000
4
Beds
2
Baths
1,480
Sq Ft
$780/Sq Ft
Est. Value
About This Home
This home is located at 8681 Royer Cir, Huntington Beach, CA 92647 and is currently estimated at $1,154,151, approximately $779 per square foot. 8681 Royer Cir is a home located in Orange County with nearby schools including Vista View Middle School, Ocean View High, and Sycamore Creek Community Charter School.
Ownership History
Date
Name
Owned For
Owner Type
Purchase Details
Closed on
Jul 19, 2024
Sold by
Perez Gabriel and Perez Deborah Henry
Bought by
Perez Family Trust and Perez
Current Estimated Value
Purchase Details
Closed on
Sep 22, 2005
Sold by
Perez Gabriel and Perez Deborah H
Bought by
Perez Gabriel and Perez Deborah H
Home Financials for this Owner
Home Financials are based on the most recent Mortgage that was taken out on this home.
Original Mortgage
$230,000
Interest Rate
5.12%
Mortgage Type
Purchase Money Mortgage
Purchase Details
Closed on
Aug 12, 2005
Sold by
Perez Gabriel
Bought by
Perez Gabriel and Perez Deborah H
Home Financials for this Owner
Home Financials are based on the most recent Mortgage that was taken out on this home.
Original Mortgage
$230,000
Interest Rate
5.12%
Mortgage Type
Purchase Money Mortgage
Create a Home Valuation Report for This Property
The Home Valuation Report is an in-depth analysis detailing your home's value as well as a comparison with similar homes in the area
Home Values in the Area
Average Home Value in this Area
Purchase History
| Date | Buyer | Sale Price | Title Company |
|---|---|---|---|
| Perez Family Trust | -- | None Listed On Document | |
| Perez Gabriel | -- | Ort | |
| Perez Gabriel | -- | -- |
Source: Public Records
Mortgage History
| Date | Status | Borrower | Loan Amount |
|---|---|---|---|
| Previous Owner | Perez Gabriel | $230,000 |
Source: Public Records
Tax History Compared to Growth
Tax History
| Year | Tax Paid | Tax Assessment Tax Assessment Total Assessment is a certain percentage of the fair market value that is determined by local assessors to be the total taxable value of land and additions on the property. | Land | Improvement |
|---|---|---|---|---|
| 2025 | $1,087 | $71,891 | $25,537 | $46,354 |
| 2024 | $1,087 | $70,482 | $25,036 | $45,446 |
| 2023 | $1,057 | $69,100 | $24,545 | $44,555 |
| 2022 | $1,035 | $67,746 | $24,064 | $43,682 |
| 2021 | $1,016 | $66,418 | $23,592 | $42,826 |
| 2020 | $1,004 | $65,737 | $23,350 | $42,387 |
| 2019 | $991 | $64,449 | $22,893 | $41,556 |
| 2018 | $971 | $63,186 | $22,444 | $40,742 |
| 2017 | $955 | $61,948 | $22,004 | $39,944 |
| 2016 | $923 | $60,734 | $21,573 | $39,161 |
| 2015 | $908 | $59,822 | $21,249 | $38,573 |
| 2014 | $888 | $58,651 | $20,833 | $37,818 |
Source: Public Records
Map
Nearby Homes
- 16551 Ross Ln
- 16871 Ross Ln
- 16761 Irby Ln
- 16781 Scotsdale Cir
- 16782 Heritage Ln
- 9446 Gardenia Ave
- 16102 Malaga Ln
- 16806 Olive St
- 16637 Viewpoint Ln Unit 12D
- 17475 Santa Lucia St
- 9485 Geranium Cir
- 7901 Rhine Dr
- 8171 Holland Dr
- 17391 Waal Cir
- 8402 Slater Ave
- 16767 Madrone Cir
- 17391 Meer Cir
- 16962 Westwood Ln Unit 14
- 8822 Palos Verdes Ave
- 8961 Emerald Ave
- 8691 Royer Cir
- 8661 Royer Cir
- 8682 Wagers Cir
- 8692 Wagers Cir
- 8662 Wagers Cir
- 16601 Ross Ln
- 8651 Royer Cir
- 16591 Ross Ln
- 8682 Royer Cir
- 8692 Royer Cir
- 8652 Wagers Cir
- 8652 Royer Cir
- 8662 Royer Cir
- 16631 Ross Ln
- 8681 Wagers Cir
- 8681 Parker Cir
- 8661 Parker Cir
- 8691 Wagers Cir
- 8651 Wagers Cir
- 8691 Parker Cir