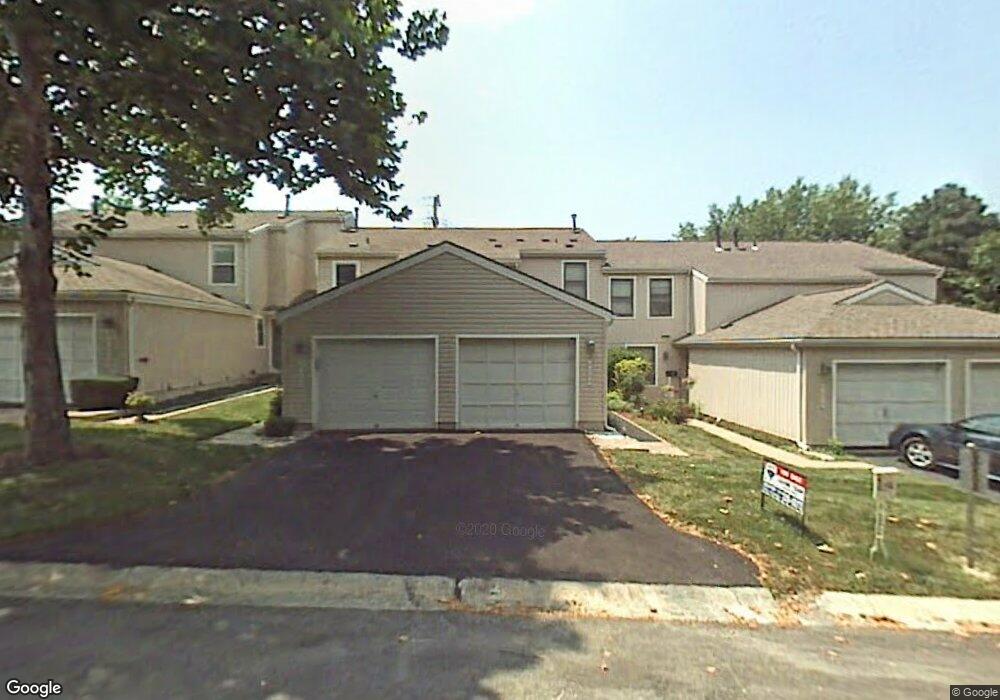
8684 W 108th Place Overland Park, KS 66210
Central Overland Park NeighborhoodEstimated Value: $222,546 - $246,000
2
Beds
3
Baths
1,064
Sq Ft
$217/Sq Ft
Est. Value
About This Home
This home is located at 8684 W 108th Place, Overland Park, KS 66210 and is currently estimated at $230,637, approximately $216 per square foot. 8684 W 108th Place is a home located in Johnson County with nearby schools including Valley Park Elementary School, Overland Trail Middle School, and Blue Valley North High School.
Ownership History
Date
Name
Owned For
Owner Type
Purchase Details
Closed on
Apr 7, 2010
Sold by
Hill Patrick S
Bought by
Arnesman Emaleigh B
Current Estimated Value
Home Financials for this Owner
Home Financials are based on the most recent Mortgage that was taken out on this home.
Original Mortgage
$83,435
Outstanding Balance
$55,295
Interest Rate
4.9%
Mortgage Type
FHA
Estimated Equity
$175,342
Purchase Details
Closed on
Sep 24, 2007
Sold by
Ellington Lisa D
Bought by
Hill Patrick S
Home Financials for this Owner
Home Financials are based on the most recent Mortgage that was taken out on this home.
Original Mortgage
$123,028
Interest Rate
6.48%
Mortgage Type
FHA
Purchase Details
Closed on
Dec 7, 2001
Sold by
Prieto Maria D
Bought by
Ellington Lisa D
Home Financials for this Owner
Home Financials are based on the most recent Mortgage that was taken out on this home.
Original Mortgage
$103,100
Interest Rate
6.52%
Mortgage Type
FHA
Create a Home Valuation Report for This Property
The Home Valuation Report is an in-depth analysis detailing your home's value as well as a comparison with similar homes in the area
Home Values in the Area
Average Home Value in this Area
Purchase History
| Date | Buyer | Sale Price | Title Company |
|---|---|---|---|
| Arnesman Emaleigh B | -- | Chicago Title Ins Co | |
| Hill Patrick S | -- | Chicago Title Ins Co | |
| Ellington Lisa D | -- | Security Land Title Company |
Source: Public Records
Mortgage History
| Date | Status | Borrower | Loan Amount |
|---|---|---|---|
| Open | Arnesman Emaleigh B | $83,435 | |
| Previous Owner | Hill Patrick S | $123,028 | |
| Previous Owner | Ellington Lisa D | $103,100 |
Source: Public Records
Tax History Compared to Growth
Tax History
| Year | Tax Paid | Tax Assessment Tax Assessment Total Assessment is a certain percentage of the fair market value that is determined by local assessors to be the total taxable value of land and additions on the property. | Land | Improvement |
|---|---|---|---|---|
| 2024 | $2,196 | $22,218 | $3,343 | $18,875 |
| 2023 | $2,108 | $20,585 | $3,343 | $17,242 |
| 2022 | $1,991 | $19,101 | $2,571 | $16,530 |
| 2021 | $1,991 | $17,526 | $2,571 | $14,955 |
| 2020 | $1,966 | $17,549 | $2,236 | $15,313 |
| 2019 | $1,807 | $15,801 | $2,236 | $13,565 |
| 2018 | $1,556 | $13,351 | $2,032 | $11,319 |
| 2017 | $1,422 | $12,006 | $1,935 | $10,071 |
| 2016 | $1,398 | $11,799 | $1,935 | $9,864 |
| 2015 | $1,328 | $11,201 | $1,935 | $9,266 |
| 2013 | -- | $10,729 | $1,935 | $8,794 |
Source: Public Records
Map
Nearby Homes
- 8607 W 108 Place
- 8819 W 106th Terrace
- 8858 W 106th Terrace
- 11163 Eby St
- 8500 W 113th St
- 8726 W 104th St
- 8712 W 113th St
- 11316 Hemlock St
- 9006 W 104th Terrace
- 10310 Eby St
- 11404 Grandview Dr
- 9604 W 106th St
- 9013 W 115th St
- 9504 W 104th St
- 9601 W 104th Terrace
- 9701 W 104th St
- 11447 Craig St
- 10529 Wedd St
- 9805 W 104th Terrace
- 11309 Riley St
- 8690 W 108th Place
- 8694 W 108th Place
- 8672 W 108th Place
- 8698 W 108th Place
- 8654 W 108th Place
- 8648 W 108th Place
- 8642 W 108th Place
- 8660 W 108th Place
- 8666 W 108th Place
- 8687 W 108th Place
- 8693 W 108th Place
- 8681 W 108th Place
- 8675 W 108th Place Unit C
- 8669 W 108th Place
- 8663 W 108th Place
- 8657 W 108th Place
- 8606 W 108th Place
- 8600 W 108th Place
- 8612 W 108th Place
- 8618 W 108th Place Unit 7D