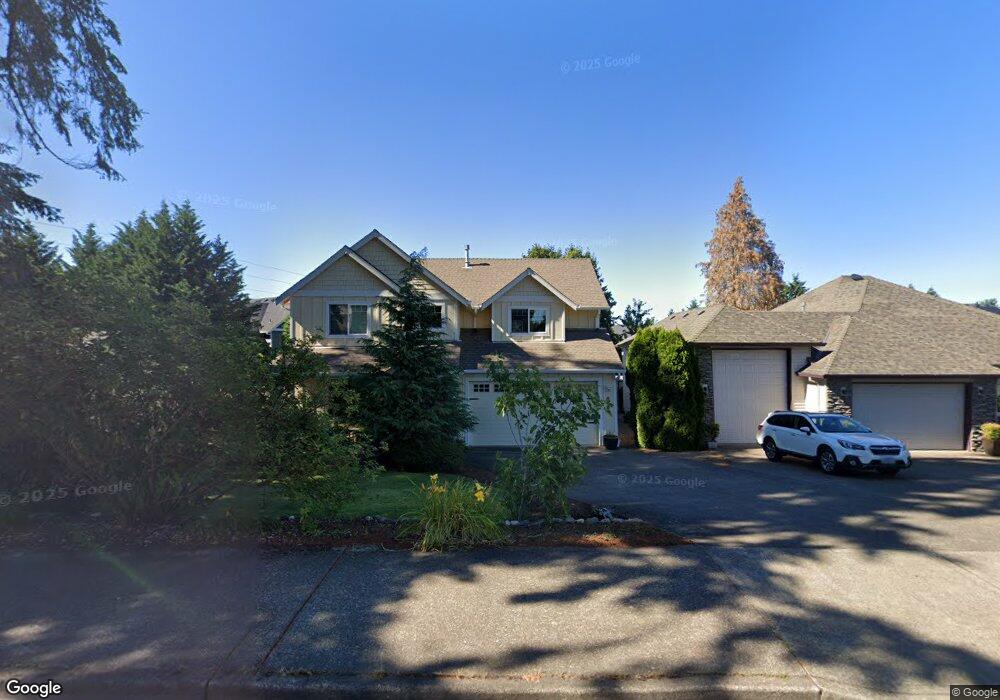
8685 SW Sagert St Tualatin, OR 97062
Estimated Value: $578,000 - $706,000
3
Beds
2
Baths
1,329
Sq Ft
$486/Sq Ft
Est. Value
About This Home
This home is located at 8685 SW Sagert St, Tualatin, OR 97062 and is currently estimated at $645,993, approximately $486 per square foot. 8685 SW Sagert St is a home located in Washington County with nearby schools including Byrom Elementary School, Hazelbrook Middle School, and Tualatin High School.
Ownership History
Date
Name
Owned For
Owner Type
Purchase Details
Closed on
Oct 30, 2015
Sold by
Caffall Curt G and Caffall Leslie
Bought by
Caffall Curt G and Caffall Leslie
Current Estimated Value
Purchase Details
Closed on
Feb 28, 2008
Sold by
Johnson John M and Johnson Gwen L
Bought by
Caffall Curt G and Caffall Leslie
Home Financials for this Owner
Home Financials are based on the most recent Mortgage that was taken out on this home.
Original Mortgage
$256,000
Outstanding Balance
$157,162
Interest Rate
5.64%
Mortgage Type
Unknown
Estimated Equity
$488,831
Purchase Details
Closed on
Feb 15, 2006
Sold by
Tindall Karen E
Bought by
Johnson John M and Johnson Gwen L
Home Financials for this Owner
Home Financials are based on the most recent Mortgage that was taken out on this home.
Original Mortgage
$227,000
Interest Rate
6.2%
Mortgage Type
Fannie Mae Freddie Mac
Create a Home Valuation Report for This Property
The Home Valuation Report is an in-depth analysis detailing your home's value as well as a comparison with similar homes in the area
Home Values in the Area
Average Home Value in this Area
Purchase History
| Date | Buyer | Sale Price | Title Company |
|---|---|---|---|
| Caffall Curt G | -- | None Available | |
| Caffall Curt G | $320,000 | Pacific Nw Title | |
| Johnson John M | $350,000 | Pacific Nw Title |
Source: Public Records
Mortgage History
| Date | Status | Borrower | Loan Amount |
|---|---|---|---|
| Open | Caffall Curt G | $256,000 | |
| Previous Owner | Johnson John M | $227,000 |
Source: Public Records
Tax History Compared to Growth
Tax History
| Year | Tax Paid | Tax Assessment Tax Assessment Total Assessment is a certain percentage of the fair market value that is determined by local assessors to be the total taxable value of land and additions on the property. | Land | Improvement |
|---|---|---|---|---|
| 2026 | $6,141 | $371,860 | -- | -- |
| 2025 | $6,141 | $361,030 | -- | -- |
| 2024 | $5,980 | $350,520 | -- | -- |
| 2023 | $5,980 | $340,320 | $0 | $0 |
| 2022 | $5,721 | $340,320 | $0 | $0 |
| 2021 | $5,582 | $320,790 | $0 | $0 |
| 2020 | $5,416 | $311,450 | $0 | $0 |
| 2019 | $5,271 | $302,380 | $0 | $0 |
| 2018 | $5,057 | $293,580 | $0 | $0 |
| 2017 | $4,761 | $285,030 | $0 | $0 |
| 2016 | $4,539 | $276,730 | $0 | $0 |
| 2015 | $4,356 | $268,670 | $0 | $0 |
| 2014 | $4,232 | $260,850 | $0 | $0 |
Source: Public Records
Map
Nearby Homes
- 8524 SW Mohawk St Unit 8524
- 8512 SW Mohawk St Unit 8512
- 20305 SW 86th Ave
- 20168 SW Tillamook Ct
- 20182 SW Tillamook Ct
- 8196 SW Shenandoah Way Unit 8196
- 8370 SW Seminole Trail
- 20025 SW 94th Place
- 20685 SW Siletz Ct
- 8501 SW Iroquois Dr
- 8200 SW Piute Ct
- 8475 SW Tualatin Rd
- 7191 SW Sagert St Unit 103
- 9495 SW Cherry Ln
- 7165 SW Sagert St Unit 107
- 8720 SW Tualatin Rd Unit 315
- 8720 SW Tualatin Rd Unit 201
- 7143 SW Sagert St Unit 104
- 19685 SW 68th Ave
- 20900 SW Winema Dr
- 8675 SW Sagert St
- 8678 SW Logan Ln
- 8735 SW Sagert St
- 8700 SW Logan Ln
- 8635 SW Sagert St
- 8652 SW Logan Ln
- 8625 SW Sagert St
- 8614 SW Logan Ln Unit 5
- 8693 SW Logan Ln
- 8667 SW Logan Ln
- 8667 SW Logan Ln Unit 2
- 8631 SW Logan Ln
- 8585 SW Sagert St
- 8609 SW Logan Ln
- 8581 SW Sagert St
- 8800 SW Sagert St
- 8577 SW Sagert St
- 20002 SW 86th Ave
- 19840 SW Boones Ferry Rd
- 19945 SW Boones Ferry Rd