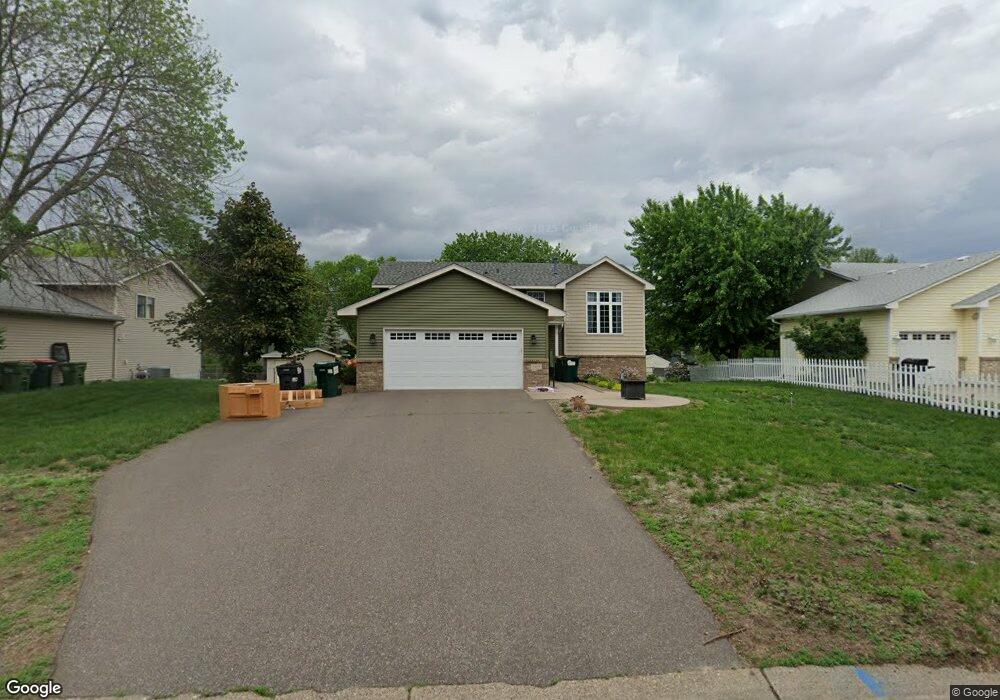
869 114th Ln NE Minneapolis, MN 55434
Estimated Value: $391,000 - $420,000
5
Beds
2
Baths
2,066
Sq Ft
$195/Sq Ft
Est. Value
About This Home
This home is located at 869 114th Ln NE, Minneapolis, MN 55434 and is currently estimated at $403,128, approximately $195 per square foot. 869 114th Ln NE is a home located in Anoka County with nearby schools including Jefferson Elementary School, Northdale Middle School, and Blaine Senior High School.
Ownership History
Date
Name
Owned For
Owner Type
Purchase Details
Closed on
Apr 25, 2022
Sold by
Betzler Jeromy and Betzler Jennifer
Bought by
Kimmes Shannon and Kimmes Andrew
Current Estimated Value
Home Financials for this Owner
Home Financials are based on the most recent Mortgage that was taken out on this home.
Original Mortgage
$324,421
Outstanding Balance
$303,967
Interest Rate
3.85%
Mortgage Type
New Conventional
Estimated Equity
$99,161
Purchase Details
Closed on
Oct 30, 2015
Sold by
Nelson Erin Erin
Bought by
Betzler Jeromy Jeromy
Home Financials for this Owner
Home Financials are based on the most recent Mortgage that was taken out on this home.
Original Mortgage
$261,182
Interest Rate
3.76%
Purchase Details
Closed on
Aug 21, 1997
Sold by
Timber Creek Homes Inc
Bought by
Zahn Randall L and Zahn Kristin K
Purchase Details
Closed on
Nov 26, 1996
Sold by
North Suburban Development Inc
Bought by
544 Special Llp
Create a Home Valuation Report for This Property
The Home Valuation Report is an in-depth analysis detailing your home's value as well as a comparison with similar homes in the area
Home Values in the Area
Average Home Value in this Area
Purchase History
| Date | Buyer | Sale Price | Title Company |
|---|---|---|---|
| Kimmes Shannon | $380,000 | -- | |
| Betzler Jeromy Jeromy | $266,000 | -- | |
| Zahn Randall L | $120,347 | -- | |
| Timber Creek Homes Inc | $28,900 | -- | |
| 544 Special Llp | $153,000 | -- |
Source: Public Records
Mortgage History
| Date | Status | Borrower | Loan Amount |
|---|---|---|---|
| Open | Kimmes Shannon | $324,421 | |
| Previous Owner | Betzler Jeromy Jeromy | $261,182 | |
| Closed | 544 Special Llp | -- |
Source: Public Records
Tax History Compared to Growth
Tax History
| Year | Tax Paid | Tax Assessment Tax Assessment Total Assessment is a certain percentage of the fair market value that is determined by local assessors to be the total taxable value of land and additions on the property. | Land | Improvement |
|---|---|---|---|---|
| 2025 | $3,771 | $365,000 | $110,000 | $255,000 |
| 2024 | $3,771 | $362,300 | $108,200 | $254,100 |
| 2023 | $3,356 | $366,500 | $103,000 | $263,500 |
| 2022 | $3,142 | $353,500 | $90,000 | $263,500 |
| 2021 | $3,306 | $295,800 | $75,000 | $220,800 |
| 2020 | $2,932 | $285,600 | $75,000 | $210,600 |
| 2019 | $2,744 | $262,100 | $67,000 | $195,100 |
| 2018 | $2,651 | $241,600 | $0 | $0 |
| 2017 | $2,376 | $228,900 | $0 | $0 |
| 2016 | $2,422 | $205,900 | $0 | $0 |
| 2015 | -- | $205,900 | $64,700 | $141,200 |
| 2014 | -- | $172,300 | $52,000 | $120,300 |
Source: Public Records
Map
Nearby Homes
- 11501 Quincy St NE
- 866 113th Ln NE
- 961 113th Ave NE
- 11500 Monroe St NE
- 11676 Able St NE
- 11683 Polk St NE
- 11429 Pierce St NE
- XXX Pierce Ct NE
- 11737 Able St NE
- 11365 Pierce St NE
- 11213 Fillmore St NE
- 11741 Fillmore St NE
- 11150 Jefferson St NE
- 11038 Polk St NE
- 11119 Jefferson St NE
- 11765 Jefferson St NE
- 1000 Oak Ridge Point NE
- 11419 6th Place NE Unit 249
- 11407 6th Place NE Unit 246
- 11355 6th Place NE Unit 241
- 857 114th Ln NE
- 881 114th Ln NE
- 845 114th Ln NE
- 893 114th Ln NE
- 870 115th Ave NE
- 876 114th Ln NE
- 864 114th Ln NE
- 858 115th Ave NE
- 882 115th Ave NE
- 852 114th Ln NE
- 846 115th Ave NE
- 833 114th Ln NE
- 11436 Tyler St NE
- 894 115th Ave NE
- 840 114th Ln NE
- 834 115th Ave NE
- 11420 Tyler St NE
- 828 114th Ln NE
- 821 114th Ln NE
- 822 115th Ave NE