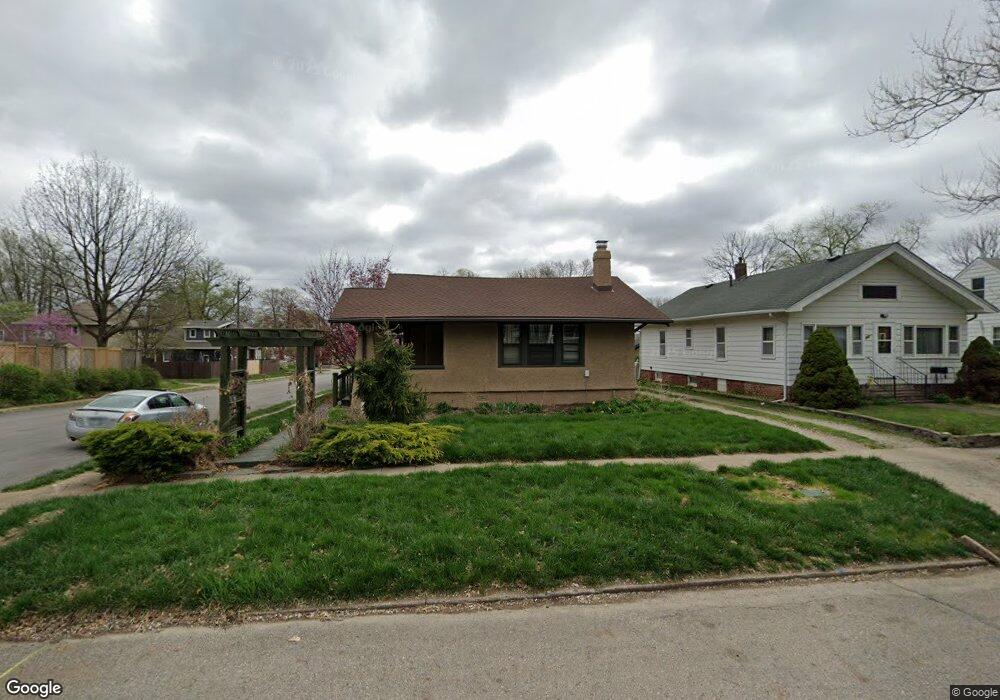
869 40th St Des Moines, IA 50312
Drake NeighborhoodEstimated Value: $184,000 - $242,000
2
Beds
1
Bath
963
Sq Ft
$224/Sq Ft
Est. Value
About This Home
This home is located at 869 40th St, Des Moines, IA 50312 and is currently estimated at $215,557, approximately $223 per square foot. 869 40th St is a home located in Polk County with nearby schools including Hubbell Elementary, Roosevelt High School, and St Augustin Catholic School.
Ownership History
Date
Name
Owned For
Owner Type
Purchase Details
Closed on
Sep 8, 2022
Sold by
Marren James A
Bought by
James A Marren Trust
Current Estimated Value
Purchase Details
Closed on
May 11, 2022
Sold by
Marren James A and Byard Mary
Bought by
James A Marren Trust and Mary Byard Marren Trust
Create a Home Valuation Report for This Property
The Home Valuation Report is an in-depth analysis detailing your home's value as well as a comparison with similar homes in the area
Home Values in the Area
Average Home Value in this Area
Purchase History
| Date | Buyer | Sale Price | Title Company |
|---|---|---|---|
| James A Marren Trust | -- | -- | |
| Marren James A | -- | -- | |
| James A Marren Trust | -- | Eganhouse Michael S | |
| James A Marren Trust | -- | None Listed On Document |
Source: Public Records
Tax History Compared to Growth
Tax History
| Year | Tax Paid | Tax Assessment Tax Assessment Total Assessment is a certain percentage of the fair market value that is determined by local assessors to be the total taxable value of land and additions on the property. | Land | Improvement |
|---|---|---|---|---|
| 2025 | $3,546 | $226,400 | $48,400 | $178,000 |
| 2024 | $3,546 | $206,400 | $43,800 | $162,600 |
| 2023 | $3,784 | $206,400 | $43,800 | $162,600 |
| 2022 | $3,752 | $172,800 | $38,400 | $134,400 |
| 2021 | $3,578 | $172,800 | $38,400 | $134,400 |
| 2020 | $3,710 | $155,300 | $34,600 | $120,700 |
| 2019 | $3,342 | $155,300 | $34,600 | $120,700 |
| 2018 | $3,300 | $136,100 | $30,100 | $106,000 |
| 2017 | $3,060 | $136,100 | $30,100 | $106,000 |
| 2016 | $2,974 | $124,900 | $27,400 | $97,500 |
| 2015 | $2,974 | $124,900 | $27,400 | $97,500 |
| 2014 | $2,742 | $119,400 | $26,100 | $93,300 |
Source: Public Records
Map
Nearby Homes
- 870 39th St
- 1005 38th St
- 1008 Kingman Cir
- 1001 42nd St
- 725 40th St
- 744 37th St
- 4036 Plainview Dr
- 4200 Kingman Blvd
- 4303 Crocker St
- 3908 Pleasant St
- 3525 Center St
- 4012 Pleasant St
- 1070 37th St
- 689 42nd St
- 3406 School St
- 708 35th St
- 4000 University Ave Unit 7
- 740 34th St
- 1021 45th St
- 3821 University Ave