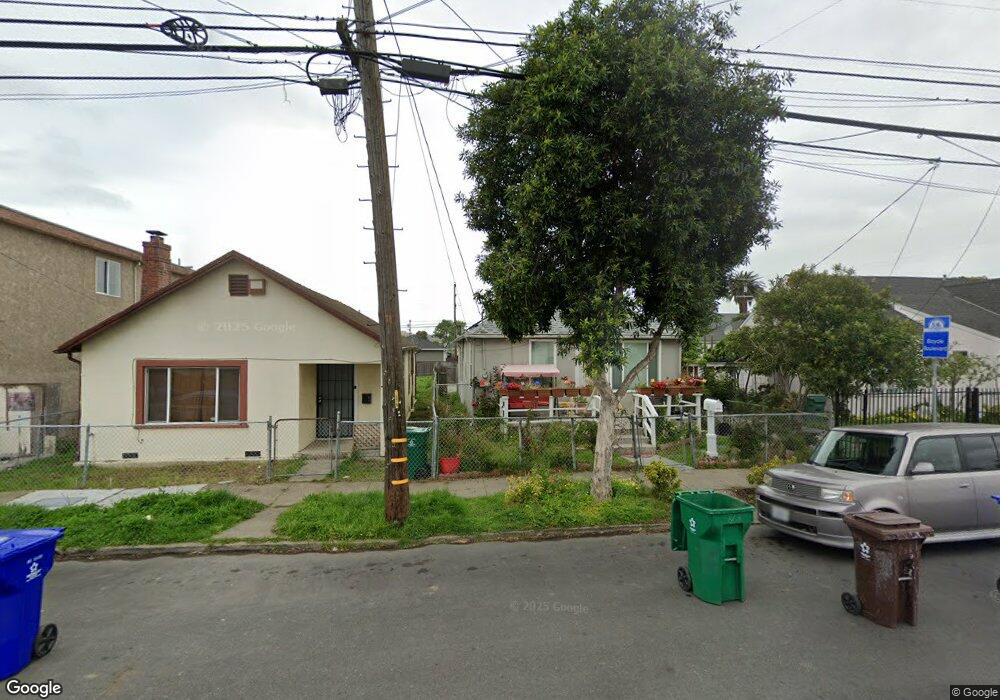
869 8th St Richmond, CA 94801
Iron Triangle NeighborhoodEstimated Value: $452,000 - $547,000
3
Beds
1
Bath
911
Sq Ft
$564/Sq Ft
Est. Value
About This Home
This home is located at 869 8th St, Richmond, CA 94801 and is currently estimated at $513,710, approximately $563 per square foot. 869 8th St is a home located in Contra Costa County with nearby schools including Peres Elementary School, Walter T. Helms Middle School, and Richmond High School.
Ownership History
Date
Name
Owned For
Owner Type
Purchase Details
Closed on
Dec 20, 2020
Sold by
Rodrigez Wilma A
Bought by
Rodriguez Eliot J Vega
Current Estimated Value
Home Financials for this Owner
Home Financials are based on the most recent Mortgage that was taken out on this home.
Original Mortgage
$336,030
Interest Rate
3.11%
Purchase Details
Closed on
Mar 12, 2019
Sold by
Barrera Ramiro Saravia
Bought by
Rodriguez Wilma America and Rodriguez Julio F
Home Financials for this Owner
Home Financials are based on the most recent Mortgage that was taken out on this home.
Original Mortgage
$348,078
Interest Rate
4.4%
Mortgage Type
FHA
Purchase Details
Closed on
May 23, 2018
Sold by
Martinez Mirna E Rodriguez
Bought by
Barrera Ramiro Saravia
Home Financials for this Owner
Home Financials are based on the most recent Mortgage that was taken out on this home.
Original Mortgage
$237,040
Interest Rate
4.4%
Mortgage Type
New Conventional
Purchase Details
Closed on
Feb 8, 2010
Sold by
Lindeman Charles R
Bought by
Lindeman Charles R
Purchase Details
Closed on
Sep 25, 1997
Sold by
Federal National Mortgage Association
Bought by
Linderman Charles R
Home Financials for this Owner
Home Financials are based on the most recent Mortgage that was taken out on this home.
Original Mortgage
$24,650
Interest Rate
7.49%
Mortgage Type
Purchase Money Mortgage
Purchase Details
Closed on
Mar 18, 1997
Sold by
Carrington Linnie F
Bought by
Federal National Mortgage Association
Create a Home Valuation Report for This Property
The Home Valuation Report is an in-depth analysis detailing your home's value as well as a comparison with similar homes in the area
Home Values in the Area
Average Home Value in this Area
Purchase History
| Date | Buyer | Sale Price | Title Company |
|---|---|---|---|
| Rodriguez Eliot J Vega | -- | None Listed On Document | |
| Rodriguez Wilma America | $354,500 | Old Republic Title Company | |
| Barrera Ramiro Saravia | -- | North American Title Company | |
| Barrera Ramiro Saravia | $297,000 | North American Title Company | |
| Lindeman Charles R | -- | None Available | |
| Linderman Charles R | $29,500 | Chicago Title Co | |
| Federal National Mortgage Association | $40,000 | First American Title Ins Co |
Source: Public Records
Mortgage History
| Date | Status | Borrower | Loan Amount |
|---|---|---|---|
| Previous Owner | Rodriguez Eliot J Vega | $336,030 | |
| Previous Owner | Rodriguez Wilma America | $348,078 | |
| Previous Owner | Barrera Ramiro Saravia | $237,040 | |
| Previous Owner | Linderman Charles R | $24,650 |
Source: Public Records
Tax History
| Year | Tax Paid | Tax Assessment Tax Assessment Total Assessment is a certain percentage of the fair market value that is determined by local assessors to be the total taxable value of land and additions on the property. | Land | Improvement |
|---|---|---|---|---|
| 2025 | $7,922 | $459,183 | $208,324 | $250,859 |
| 2024 | $7,649 | $450,181 | $204,240 | $245,941 |
| 2023 | $7,649 | $441,355 | $200,236 | $241,119 |
| 2022 | $6,646 | $372,641 | $194,467 | $178,174 |
| 2021 | $6,569 | $365,335 | $190,654 | $174,681 |
| 2019 | $5,526 | $302,226 | $247,758 | $54,468 |
| 2018 | $1,753 | $40,676 | $24,547 | $16,129 |
| 2017 | $1,690 | $39,879 | $24,066 | $15,813 |
| 2016 | $1,627 | $39,098 | $23,595 | $15,503 |
| 2015 | $1,582 | $38,512 | $23,241 | $15,271 |
| 2014 | $1,579 | $37,758 | $22,786 | $14,972 |
Source: Public Records
Map
Nearby Homes
Your Personal Tour Guide
Ask me questions while you tour the home.