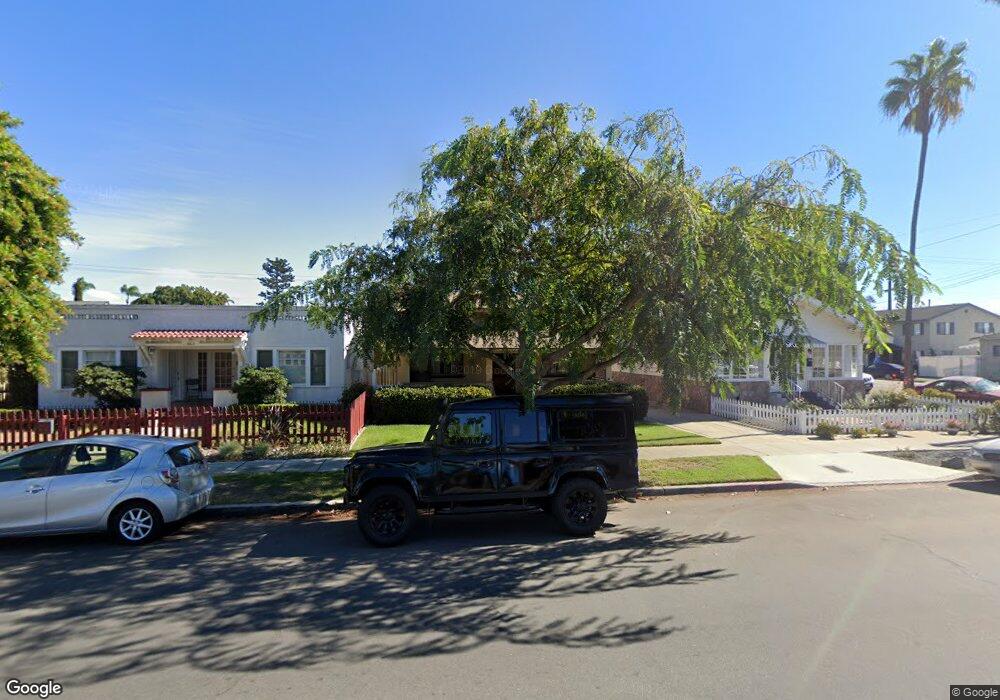
869 C Ave Coronado, CA 92118
Estimated Value: $1,777,341 - $3,047,000
2
Beds
2
Baths
1,344
Sq Ft
$1,747/Sq Ft
Est. Value
About This Home
This home is located at 869 C Ave, Coronado, CA 92118 and is currently estimated at $2,348,585, approximately $1,747 per square foot. 869 C Ave is a home located in San Diego County with nearby schools including Coronado Village Elementary, Coronado Middle School, and Coronado High School.
Ownership History
Date
Name
Owned For
Owner Type
Purchase Details
Closed on
Oct 24, 2019
Sold by
Foley Sean Michael
Bought by
Foley Sean Michael
Current Estimated Value
Purchase Details
Closed on
Apr 25, 2019
Sold by
Sean Michael Foley Trust
Bought by
St Vincent De Paul Village
Purchase Details
Closed on
Jun 8, 1994
Sold by
Foley Edmund F and Foley Delia O
Bought by
Foley Edmund F and Foley Delia O
Create a Home Valuation Report for This Property
The Home Valuation Report is an in-depth analysis detailing your home's value as well as a comparison with similar homes in the area
Home Values in the Area
Average Home Value in this Area
Purchase History
| Date | Buyer | Sale Price | Title Company |
|---|---|---|---|
| Foley Sean Michael | -- | None Available | |
| St Vincent De Paul Village | -- | None Available | |
| Foley Edmund F | -- | -- |
Source: Public Records
Tax History
| Year | Tax Paid | Tax Assessment Tax Assessment Total Assessment is a certain percentage of the fair market value that is determined by local assessors to be the total taxable value of land and additions on the property. | Land | Improvement |
|---|---|---|---|---|
| 2025 | $1,549 | $87,979 | $44,092 | $43,887 |
| 2024 | $1,549 | $86,255 | $43,228 | $43,027 |
| 2023 | $1,533 | $84,565 | $42,381 | $42,184 |
| 2022 | $1,514 | $82,907 | $41,550 | $41,357 |
| 2021 | $1,501 | $81,283 | $40,736 | $40,547 |
| 2020 | $1,476 | $80,451 | $40,319 | $40,132 |
| 2019 | $1,400 | $78,875 | $39,529 | $39,346 |
| 2018 | $1,384 | $77,329 | $38,754 | $38,575 |
| 2017 | $1,329 | $75,814 | $37,995 | $37,819 |
| 2016 | $1,263 | $74,328 | $37,250 | $37,078 |
| 2015 | $1,211 | $73,213 | $36,691 | $36,522 |
| 2014 | $1,147 | $71,780 | $35,973 | $35,807 |
Source: Public Records
Map
Nearby Homes
- 855 C Ave
- 861 B Ave
- 868 A Ave
- 835 D Ave Unit 5
- 835 D Ave Unit 4
- 747 Orange Ave Unit 304
- 747 Orange Ave Unit 302
- 747 Orange Ave Unit 303
- 747 Orange Ave Unit 301
- 969 Adella Ave
- 911 9th St
- 713 D Ave Unit 19
- 1058 Isabella Ave
- 848 E Ave Unit L2
- 1155 Star Park Cir Unit 1A
- 1155 Star Park Cir Unit 1D
- 1533 10th St
- 1054 Isabella Ave Unit 58
- 1056 Isabella Ave
- 1060 Isabella Ave
Your Personal Tour Guide
Ask me questions while you tour the home.