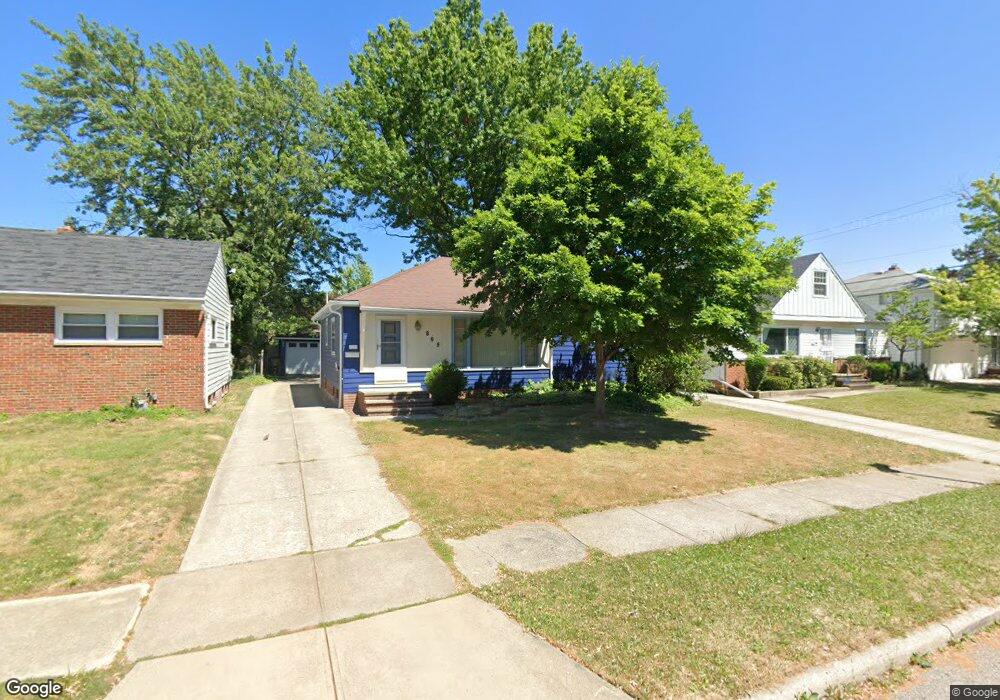
869 E 261st St Euclid, OH 44132
Estimated Value: $140,000 - $170,000
3
Beds
2
Baths
1,283
Sq Ft
$122/Sq Ft
Est. Value
About This Home
This home is located at 869 E 261st St, Euclid, OH 44132 and is currently estimated at $156,249, approximately $121 per square foot. 869 E 261st St is a home located in Cuyahoga County with nearby schools including Shoreview Elementary School, Euclid High School, and Ss Robert & William Catholic School.
Ownership History
Date
Name
Owned For
Owner Type
Purchase Details
Closed on
Jun 23, 2004
Sold by
Bruno Michael T and Bruno Barbara Ann
Bought by
Loines Brian S and Loines Hellean C
Current Estimated Value
Home Financials for this Owner
Home Financials are based on the most recent Mortgage that was taken out on this home.
Original Mortgage
$121,099
Outstanding Balance
$61,015
Interest Rate
6.46%
Mortgage Type
FHA
Estimated Equity
$95,234
Purchase Details
Closed on
Aug 19, 1986
Sold by
Smolik Stephen J
Bought by
Bruno Michael T and Bruno Barbara A
Purchase Details
Closed on
Oct 30, 1981
Sold by
Boone Robert E and Boone Barbara E
Bought by
Smolik Stephen J
Purchase Details
Closed on
Jan 1, 1975
Bought by
Boone Robert E and Boone Barbara E
Create a Home Valuation Report for This Property
The Home Valuation Report is an in-depth analysis detailing your home's value as well as a comparison with similar homes in the area
Home Values in the Area
Average Home Value in this Area
Purchase History
| Date | Buyer | Sale Price | Title Company |
|---|---|---|---|
| Loines Brian S | $123,000 | Crossroads | |
| Bruno Michael T | $69,200 | -- | |
| Smolik Stephen J | $67,500 | -- | |
| Boone Robert E | -- | -- |
Source: Public Records
Mortgage History
| Date | Status | Borrower | Loan Amount |
|---|---|---|---|
| Open | Loines Brian S | $121,099 |
Source: Public Records
Tax History
| Year | Tax Paid | Tax Assessment Tax Assessment Total Assessment is a certain percentage of the fair market value that is determined by local assessors to be the total taxable value of land and additions on the property. | Land | Improvement |
|---|---|---|---|---|
| 2024 | $3,313 | $48,195 | $8,925 | $39,270 |
| 2023 | $2,938 | $33,990 | $6,760 | $27,230 |
| 2022 | $2,871 | $33,990 | $6,760 | $27,230 |
| 2021 | $3,199 | $33,990 | $6,760 | $27,230 |
| 2020 | $3,033 | $29,300 | $5,810 | $23,490 |
| 2019 | $2,727 | $83,700 | $16,600 | $67,100 |
| 2018 | $2,730 | $29,300 | $5,810 | $23,490 |
| 2017 | $2,935 | $26,110 | $4,830 | $21,280 |
| 2016 | $2,942 | $26,110 | $4,830 | $21,280 |
| 2015 | $2,677 | $26,110 | $4,830 | $21,280 |
| 2014 | $2,677 | $26,110 | $4,830 | $21,280 |
Source: Public Records
Map
Nearby Homes
- 825 E 256th St
- 25650 Richards Ave
- 26430 Drakefield Ave
- 25700 Briardale Ave
- 643 E 261st St
- 25751 Briardale Ave
- 815 E 272nd St
- 579 E 260th St
- 890 E 250th St
- 26351 Farringdon Ave
- 27701 Mills Ave Unit 2G
- 571 E 260th St
- 24571 Alberton Rd
- 25671 Farringdon Ave
- 515 E 250th St
- 25401 Farringdon Ave
- 25731 Zeman Ave
- 730 Hemlock Dr
- 610 E 266th St
- 24181 Devoe Ave
- 875 E 261st St
- 865 E 261st St
- 26200 Aaron Dr
- 881 E 261st St
- 26155 Benton Ave
- 26171 Benton Ave
- 26183 Benton Ave
- 26216 Aaron Dr
- 870 E 261st St
- 26201 Benton Ave
- 26135 Benton Ave
- 876 E 261st St
- 866 E 261st St
- 880 E 261st St
- 26171 Aaron Dr
- 26193 Aaron Dr
- 26215 Benton Ave
- 26240 Aaron Dr
- 886 E 261st St
- 856 E 261st St
Your Personal Tour Guide
Ask me questions while you tour the home.