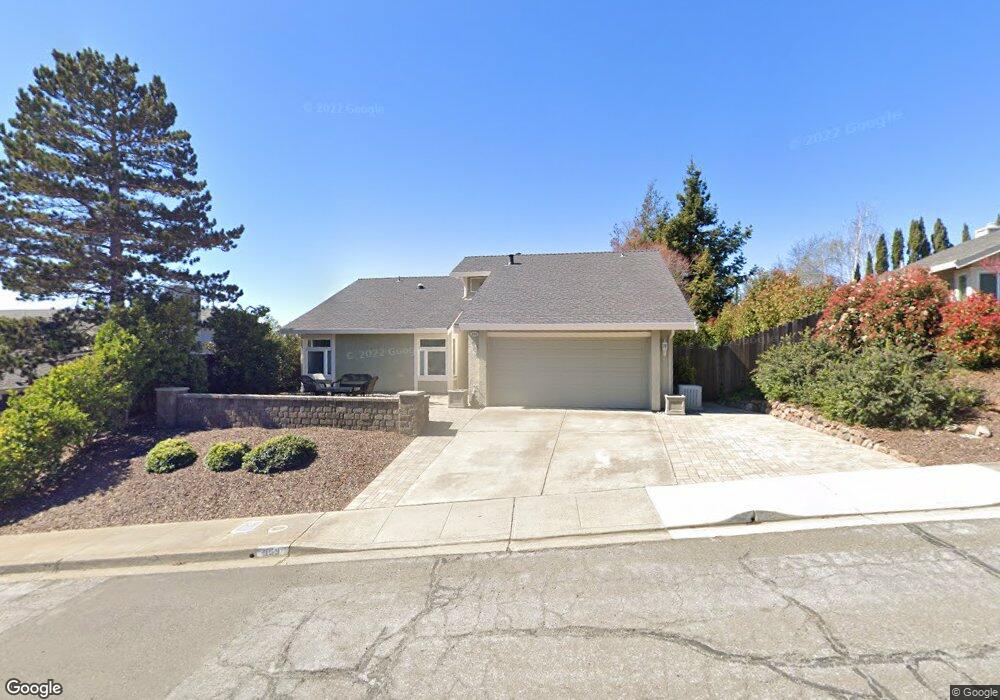
869 Hanlon Way Benicia, CA 94510
Estimated Value: $850,984 - $953,000
3
Beds
2
Baths
1,992
Sq Ft
$450/Sq Ft
Est. Value
About This Home
This home is located at 869 Hanlon Way, Benicia, CA 94510 and is currently estimated at $895,496, approximately $449 per square foot. 869 Hanlon Way is a home located in Solano County with nearby schools including Matthew Turner Elementary School, Benicia Middle School, and Benicia High School.
Ownership History
Date
Name
Owned For
Owner Type
Purchase Details
Closed on
Aug 16, 2013
Sold by
Kerr Donald B and Kerr Michelle F
Bought by
Kerr Family Revocable Trust and Kerr Michelle Fessler Kerr
Current Estimated Value
Purchase Details
Closed on
Sep 22, 1994
Sold by
Posey Raymond Owen
Bought by
Kerr Donald B and Kerr Michelle F
Home Financials for this Owner
Home Financials are based on the most recent Mortgage that was taken out on this home.
Original Mortgage
$194,750
Interest Rate
8.54%
Create a Home Valuation Report for This Property
The Home Valuation Report is an in-depth analysis detailing your home's value as well as a comparison with similar homes in the area
Home Values in the Area
Average Home Value in this Area
Purchase History
| Date | Buyer | Sale Price | Title Company |
|---|---|---|---|
| Kerr Family Revocable Trust | -- | None Available | |
| Kerr Donald B | $205,000 | Placer Title Company |
Source: Public Records
Mortgage History
| Date | Status | Borrower | Loan Amount |
|---|---|---|---|
| Closed | Kerr Donald B | $194,750 |
Source: Public Records
Tax History Compared to Growth
Tax History
| Year | Tax Paid | Tax Assessment Tax Assessment Total Assessment is a certain percentage of the fair market value that is determined by local assessors to be the total taxable value of land and additions on the property. | Land | Improvement |
|---|---|---|---|---|
| 2025 | $4,872 | $422,443 | $109,178 | $313,265 |
| 2024 | $4,872 | $414,161 | $107,038 | $307,123 |
| 2023 | $4,754 | $406,041 | $104,940 | $301,101 |
| 2022 | $4,664 | $398,081 | $102,883 | $295,198 |
| 2021 | $4,567 | $390,276 | $100,866 | $289,410 |
| 2020 | $4,506 | $386,275 | $99,832 | $286,443 |
| 2019 | $4,426 | $378,702 | $97,875 | $280,827 |
| 2018 | $4,312 | $371,277 | $95,956 | $275,321 |
| 2017 | $4,211 | $363,998 | $94,075 | $269,923 |
| 2016 | $4,241 | $356,862 | $92,231 | $264,631 |
| 2015 | $4,133 | $351,502 | $90,846 | $260,656 |
| 2014 | $4,083 | $344,618 | $89,067 | $255,551 |
Source: Public Records
Map
Nearby Homes
- 882 Oxford Way
- 837 Clifton Ct
- 780 Rose Dr
- 772 Barton Way
- 877 Rose Dr
- 633 Belvedere Dr
- 128 Newcastle Dr
- 414 Brunswick Dr
- 8842 Blue River Dr
- 187 Fleet St
- 8707 Aquamarine Dr
- 8628 Rockaway Dr
- 178 Fleet St
- 544 Fuchsia Dr
- 8649 Rockaway Dr
- 433 Brunswick Dr
- 8621 Rockaway Dr
- 176 Newcastle Dr
- 509 Solano Dr
- 8094 Waterfall Ln