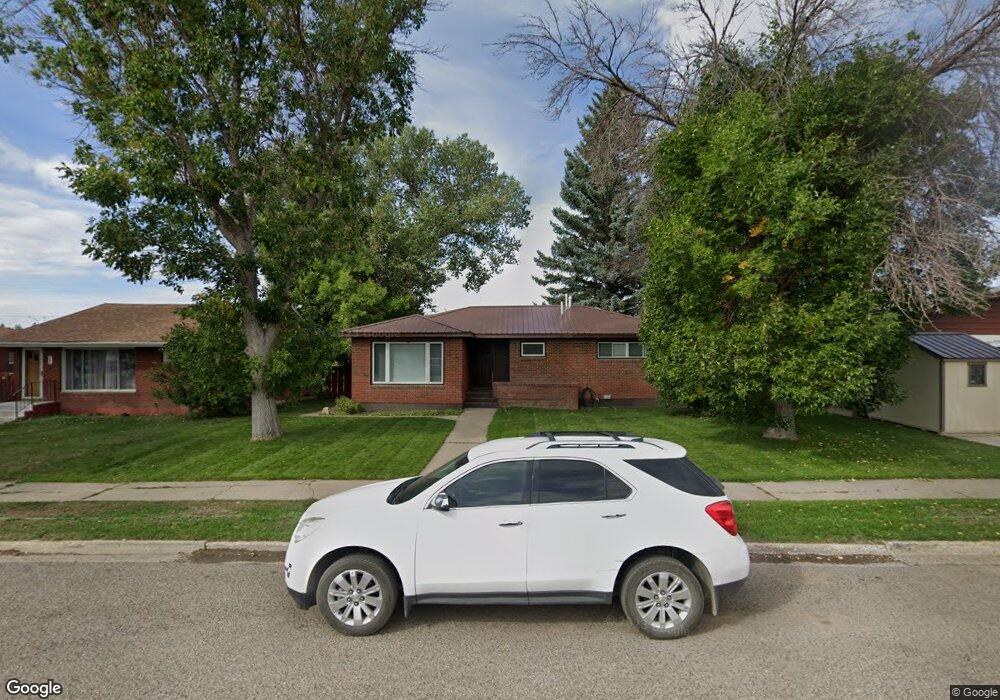
869 Hill Ave Shelby, MT 59474
Estimated Value: $222,000 - $256,217
4
Beds
2
Baths
1,378
Sq Ft
$174/Sq Ft
Est. Value
About This Home
This home is located at 869 Hill Ave, Shelby, MT 59474 and is currently estimated at $240,072, approximately $174 per square foot. 869 Hill Ave is a home located in Toole County with nearby schools including Shelby Elementary School, Cam Rose School, and Shelby Junior High School.
Ownership History
Date
Name
Owned For
Owner Type
Purchase Details
Closed on
Jun 23, 2023
Sold by
White Allen
Bought by
Olin Lee
Current Estimated Value
Home Financials for this Owner
Home Financials are based on the most recent Mortgage that was taken out on this home.
Original Mortgage
$239,580
Outstanding Balance
$233,539
Interest Rate
6.71%
Mortgage Type
Construction
Estimated Equity
$6,533
Purchase Details
Closed on
Sep 13, 2012
Bought by
White Allen
Home Financials for this Owner
Home Financials are based on the most recent Mortgage that was taken out on this home.
Original Mortgage
$58,000
Interest Rate
3.5%
Mortgage Type
New Conventional
Create a Home Valuation Report for This Property
The Home Valuation Report is an in-depth analysis detailing your home's value as well as a comparison with similar homes in the area
Home Values in the Area
Average Home Value in this Area
Purchase History
| Date | Buyer | Sale Price | Title Company |
|---|---|---|---|
| Olin Lee | $241,975 | -- | |
| White Allen | -- | -- | |
| White Allen | -- | -- |
Source: Public Records
Mortgage History
| Date | Status | Borrower | Loan Amount |
|---|---|---|---|
| Open | Olin Lee | $239,580 | |
| Previous Owner | White Allen | $58,000 | |
| Closed | White Allen | $80,000 |
Source: Public Records
Tax History Compared to Growth
Tax History
| Year | Tax Paid | Tax Assessment Tax Assessment Total Assessment is a certain percentage of the fair market value that is determined by local assessors to be the total taxable value of land and additions on the property. | Land | Improvement |
|---|---|---|---|---|
| 2025 | $1,574 | $245,000 | $0 | $0 |
| 2024 | $2,609 | $211,900 | $0 | $0 |
| 2023 | $2,496 | $208,800 | $0 | $0 |
| 2022 | $2,320 | $183,300 | $0 | $0 |
| 2021 | $2,072 | $183,300 | $0 | $0 |
| 2020 | $2,222 | $179,610 | $0 | $0 |
| 2019 | $2,315 | $179,610 | $0 | $0 |
| 2018 | $2,280 | $177,300 | $0 | $0 |
| 2017 | $1,856 | $177,300 | $0 | $0 |
| 2016 | $1,851 | $158,700 | $0 | $0 |
| 2015 | $1,810 | $158,700 | $0 | $0 |
| 2014 | $1,188 | $61,374 | $0 | $0 |
Source: Public Records
Map
Nearby Homes