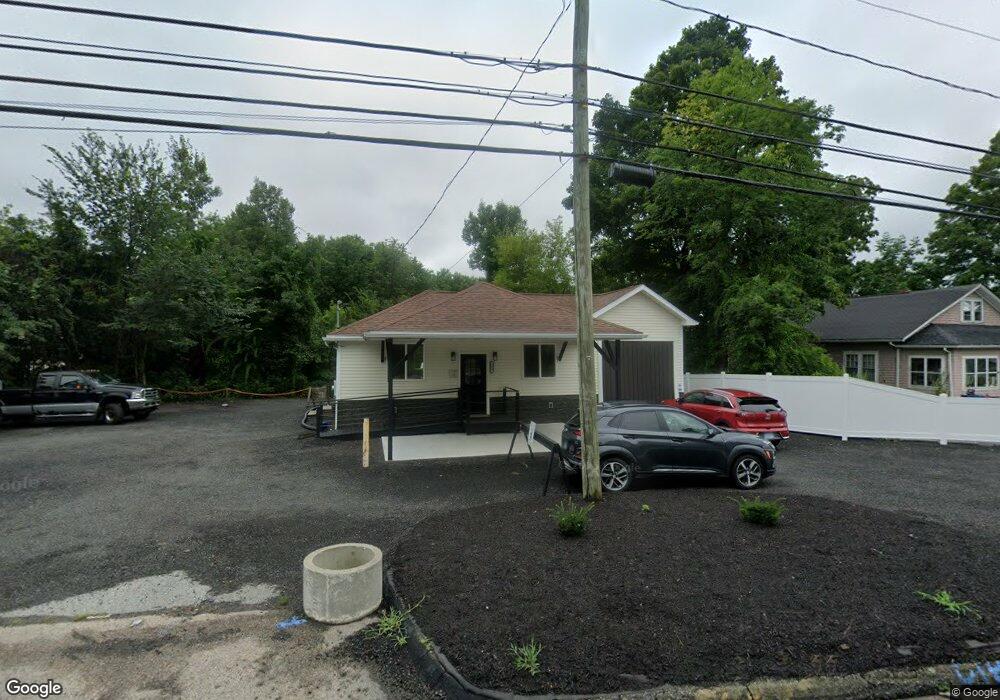
869 N Main St Danielson, CT 06239
Estimated Value: $64,321
Studio
--
Bath
1,120
Sq Ft
$57/Sq Ft
Est. Value
About This Home
This home is located at 869 N Main St, Danielson, CT 06239 and is currently priced at $64,321, approximately $57 per square foot. 869 N Main St is a home located in Windham County with nearby schools including Killingly Central School, Killingly Memorial School, and Killingly Intermediate School.
Ownership History
Date
Name
Owned For
Owner Type
Purchase Details
Closed on
May 1, 2019
Sold by
20Th Real Estate Props
Bought by
R C Bonneau Enterprises
Current Estimated Value
Purchase Details
Closed on
Oct 14, 2011
Sold by
Stop and Save Springfiel
Bought by
20Th Re Props
Purchase Details
Closed on
Jan 10, 2011
Sold by
Badat Inc
Bought by
Stop N Save Springfiel
Purchase Details
Closed on
Dec 29, 2003
Sold by
Saveway Petroleum Inc
Bought by
Badat Inc
Create a Home Valuation Report for This Property
The Home Valuation Report is an in-depth analysis detailing your home's value as well as a comparison with similar homes in the area
Home Values in the Area
Average Home Value in this Area
Purchase History
| Date | Buyer | Sale Price | Title Company |
|---|---|---|---|
| R C Bonneau Enterprises | $35,000 | -- | |
| R C Bonneau Enterprises | $35,000 | -- | |
| 20Th Re Props | $40,000 | -- | |
| 20Th Re Props | $40,000 | -- | |
| Stop N Save Springfiel | $40,000 | -- | |
| Stop N Save Springfiel | $40,000 | -- | |
| Badat Inc | $150,000 | -- | |
| Badat Inc | $150,000 | -- |
Source: Public Records
Mortgage History
| Date | Status | Borrower | Loan Amount |
|---|---|---|---|
| Previous Owner | Badat Inc | $65,000 | |
| Previous Owner | Badat Inc | $500,000 |
Source: Public Records
Tax History
| Year | Tax Paid | Tax Assessment Tax Assessment Total Assessment is a certain percentage of the fair market value that is determined by local assessors to be the total taxable value of land and additions on the property. | Land | Improvement |
|---|---|---|---|---|
| 2025 | $2,309 | $98,470 | $46,370 | $52,100 |
| 2024 | $1,122 | $50,830 | $46,370 | $4,460 |
| 2023 | $1,831 | $63,910 | $38,640 | $25,270 |
| 2022 | $1,720 | $63,910 | $38,640 | $25,270 |
| 2021 | $1,720 | $63,910 | $38,640 | $25,270 |
| 2020 | $1,683 | $63,910 | $38,640 | $25,270 |
| 2019 | $1,717 | $63,910 | $38,640 | $25,270 |
| 2017 | $2,139 | $73,220 | $38,640 | $34,580 |
| 2016 | $2,131 | $73,220 | $38,640 | $34,580 |
| 2015 | $2,146 | $73,220 | $38,640 | $34,580 |
| 2014 | $2,088 | $73,220 | $38,640 | $34,580 |
Source: Public Records
Map
Nearby Homes
- 61 Deerwood Dr
- 48 Athol St Unit 48
- 74 Athol St
- 14 Valley View Dr
- 16 Valley View Dr
- 56 Deerwood Dr
- 724 Cook Hill Rd
- 29 Rosedale St
- 144 Prospect Ave
- 941 Upper Maple St
- 85 Mashentuck Rd
- 73 Hawkins St
- 10 Center St
- 24 Center St
- 133 Maple St
- 23 Brookside Dr
- 53 Brookside Dr
- 842 Hartford Pike
- 175 Mashentuck Rd
- 102 Cottage St
Your Personal Tour Guide
Ask me questions while you tour the home.