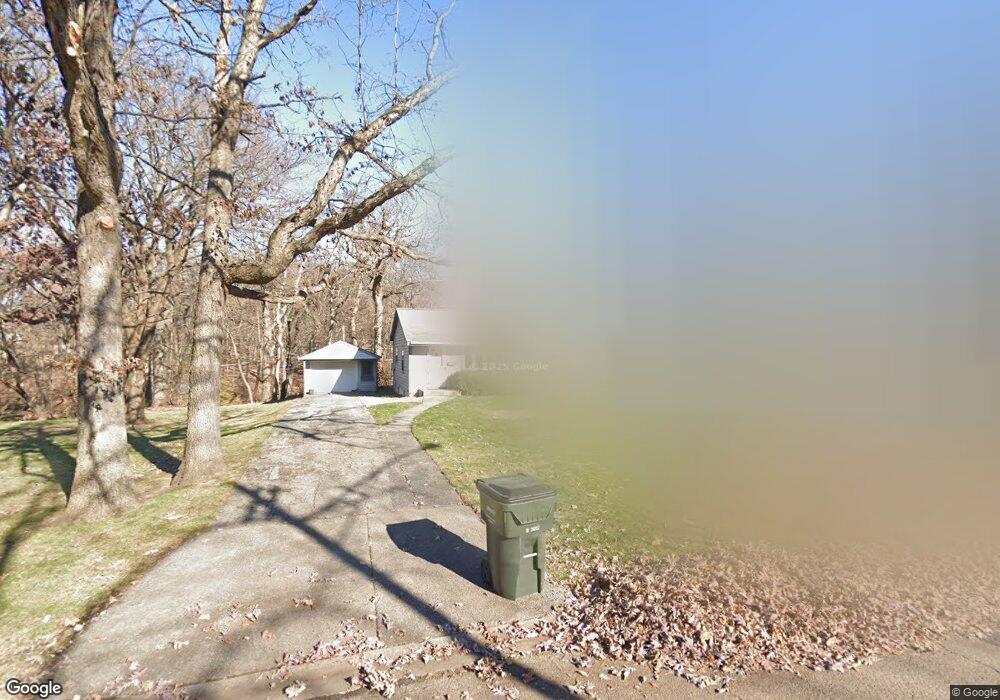
869 NE Holcomb Dr Mundelein, IL 60060
Estimated Value: $299,000 - $353,000
2
Beds
2
Baths
1,600
Sq Ft
$202/Sq Ft
Est. Value
About This Home
This home is located at 869 NE Holcomb Dr, Mundelein, IL 60060 and is currently estimated at $323,677, approximately $202 per square foot. 869 NE Holcomb Dr is a home located in Lake County with nearby schools including Washington Early Learning Center, Mechanics Grove Elementary School, and Carl Sandburg Middle School.
Ownership History
Date
Name
Owned For
Owner Type
Purchase Details
Closed on
May 7, 2012
Sold by
Evans Charles
Bought by
Brown Michael P
Current Estimated Value
Home Financials for this Owner
Home Financials are based on the most recent Mortgage that was taken out on this home.
Original Mortgage
$104,000
Outstanding Balance
$72,393
Interest Rate
4%
Mortgage Type
New Conventional
Estimated Equity
$251,284
Purchase Details
Closed on
Dec 21, 2011
Sold by
Larson Benjamin and Bank Of America
Bought by
Evans Charles
Purchase Details
Closed on
Apr 7, 2005
Sold by
Rouse Brent A
Bought by
Larson Benjamin and Larson Erin
Home Financials for this Owner
Home Financials are based on the most recent Mortgage that was taken out on this home.
Original Mortgage
$163,200
Interest Rate
6.05%
Mortgage Type
New Conventional
Purchase Details
Closed on
Apr 25, 1998
Sold by
Mahoney Carol and Estate Of Lyle K Klitzke
Bought by
Rouse Brent A
Home Financials for this Owner
Home Financials are based on the most recent Mortgage that was taken out on this home.
Original Mortgage
$112,500
Interest Rate
7.22%
Create a Home Valuation Report for This Property
The Home Valuation Report is an in-depth analysis detailing your home's value as well as a comparison with similar homes in the area
Home Values in the Area
Average Home Value in this Area
Purchase History
| Date | Buyer | Sale Price | Title Company |
|---|---|---|---|
| Brown Michael P | $130,000 | Chicago Title Insurance Co | |
| Evans Charles | $60,000 | None Available | |
| Larson Benjamin | $204,000 | First American Title | |
| Rouse Brent A | $62,500 | First American Title |
Source: Public Records
Mortgage History
| Date | Status | Borrower | Loan Amount |
|---|---|---|---|
| Open | Brown Michael P | $104,000 | |
| Previous Owner | Larson Benjamin | $163,200 | |
| Previous Owner | Rouse Brent A | $112,500 | |
| Closed | Larson Benjamin | $30,600 |
Source: Public Records
Tax History Compared to Growth
Tax History
| Year | Tax Paid | Tax Assessment Tax Assessment Total Assessment is a certain percentage of the fair market value that is determined by local assessors to be the total taxable value of land and additions on the property. | Land | Improvement |
|---|---|---|---|---|
| 2024 | $6,988 | $84,797 | $27,331 | $57,466 |
| 2023 | $6,092 | $74,487 | $24,008 | $50,479 |
| 2022 | $6,092 | $63,234 | $23,076 | $40,158 |
| 2021 | $5,909 | $61,873 | $22,579 | $39,294 |
| 2020 | $5,564 | $57,935 | $21,142 | $36,793 |
| 2019 | $5,524 | $57,384 | $20,941 | $36,443 |
| 2018 | $4,681 | $49,588 | $19,717 | $29,871 |
| 2017 | $4,616 | $48,023 | $19,095 | $28,928 |
| 2016 | $4,472 | $45,533 | $18,105 | $27,428 |
| 2015 | $4,323 | $42,558 | $16,922 | $25,636 |
| 2014 | $4,383 | $41,987 | $16,695 | $25,292 |
| 2012 | $4,024 | $44,122 | $20,537 | $23,585 |
Source: Public Records
Map
Nearby Homes
- 137 Racine Place
- 742 N Lake St
- 535 E Maple Ave
- 212 Londonderry Ct
- 659 E Maple Ave
- 1291 Banbury Rd
- 331 Plaza Cir
- 422 James Ave
- 847 Mckinley Ave
- 312 N Shaddle Ave
- 522 W Park St
- 1304 Dunleer Dr
- 728 W Maple Ave
- 261 N Shaddle Ave
- 29746 U S 45
- 841 Wilcox St
- 837 Wilcox Ave
- 851 Glenview Ave
- 547 N Ridgemoor Ave
- 973 Highland Rd
- 863 NE Holcomb Dr
- 909 NE Holcomb Dr
- 855 NE Holcomb Dr
- 915 NE Holcomb Dr
- 906 NE Holcomb Dr
- 837 NE Holcomb Dr
- 850 NE Holcomb Dr
- 927 NE Holcomb Dr
- 233 Goodwin Place
- 230 Goodwin Place
- 143 Racine Place
- 833 NE Holcomb Dr
- 240 Jeanette Place
- 225 Goodwin Place
- 234 Jeanette Place
- 827 NE Holcomb Dr
- 217 Goodwin Place
- 228 Jeanette Place
- 210 Goodwin Place