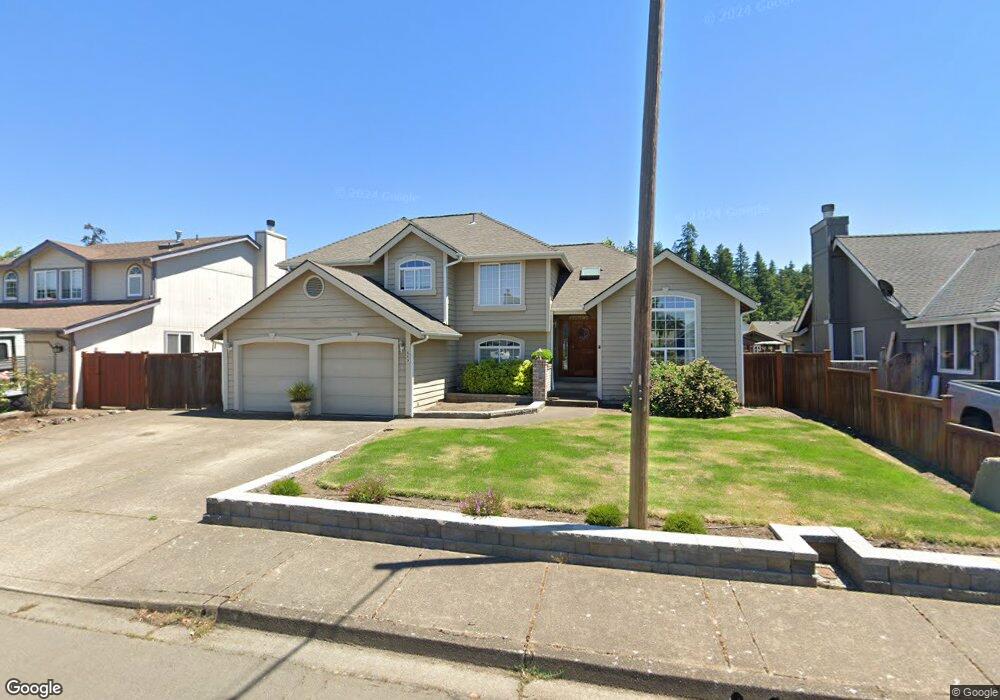
869 S 45th Place Springfield, OR 97478
East Springfield NeighborhoodEstimated Value: $508,378 - $567,000
4
Beds
3
Baths
2,074
Sq Ft
$258/Sq Ft
Est. Value
About This Home
This home is located at 869 S 45th Place, Springfield, OR 97478 and is currently estimated at $534,095, approximately $257 per square foot. 869 S 45th Place is a home located in Lane County with nearby schools including Mt. Vernon Elementary School, Agnes Stewart Middle School, and Thurston High School.
Ownership History
Date
Name
Owned For
Owner Type
Purchase Details
Closed on
Sep 24, 2007
Sold by
Pittman Conan L and Pittman Victoria M
Bought by
Pittman Conan L and Pittman Victoria M
Current Estimated Value
Home Financials for this Owner
Home Financials are based on the most recent Mortgage that was taken out on this home.
Original Mortgage
$248,000
Outstanding Balance
$157,338
Interest Rate
6.61%
Mortgage Type
New Conventional
Estimated Equity
$376,757
Purchase Details
Closed on
Jul 28, 2004
Sold by
Murphy Kevin R and Murphy Linda L
Bought by
Pittman Conan L and Balding Victoria M
Home Financials for this Owner
Home Financials are based on the most recent Mortgage that was taken out on this home.
Original Mortgage
$178,400
Interest Rate
6.75%
Mortgage Type
Purchase Money Mortgage
Purchase Details
Closed on
Mar 25, 1999
Sold by
Meneely Kenn D and Meneely Christine L
Bought by
Murphy Kevin R and Murphy Linda L
Home Financials for this Owner
Home Financials are based on the most recent Mortgage that was taken out on this home.
Original Mortgage
$106,500
Interest Rate
6.45%
Create a Home Valuation Report for This Property
The Home Valuation Report is an in-depth analysis detailing your home's value as well as a comparison with similar homes in the area
Home Values in the Area
Average Home Value in this Area
Purchase History
| Date | Buyer | Sale Price | Title Company |
|---|---|---|---|
| Pittman Conan L | -- | First American Title | |
| Pittman Conan L | $223,000 | Fidelity National Title Insu | |
| Murphy Kevin R | $176,500 | Fidelity National Title Ins |
Source: Public Records
Mortgage History
| Date | Status | Borrower | Loan Amount |
|---|---|---|---|
| Open | Pittman Conan L | $248,000 | |
| Closed | Pittman Conan L | $178,400 | |
| Previous Owner | Murphy Kevin R | $106,500 | |
| Closed | Pittman Conan L | $44,600 |
Source: Public Records
Tax History Compared to Growth
Tax History
| Year | Tax Paid | Tax Assessment Tax Assessment Total Assessment is a certain percentage of the fair market value that is determined by local assessors to be the total taxable value of land and additions on the property. | Land | Improvement |
|---|---|---|---|---|
| 2024 | $5,149 | $277,098 | -- | -- |
| 2023 | $5,149 | $269,028 | $0 | $0 |
| 2022 | $4,769 | $261,193 | $0 | $0 |
| 2021 | $4,683 | $253,586 | $0 | $0 |
| 2020 | $4,547 | $246,200 | $0 | $0 |
| 2019 | $4,410 | $239,030 | $0 | $0 |
| 2018 | $4,157 | $225,309 | $0 | $0 |
| 2017 | $3,997 | $225,309 | $0 | $0 |
| 2016 | $3,913 | $218,747 | $0 | $0 |
| 2015 | $3,802 | $212,376 | $0 | $0 |
| 2014 | $3,714 | $206,190 | $0 | $0 |
Source: Public Records
Map
Nearby Homes
- 4459 Glacier St
- 4680 Glacier Meadows Loop
- 4765 Glacier Meadows Loop
- 848 S 44th St
- 4454 Jasper Rd
- 647 S 44th St
- 4635 Daisy St
- 4324 Forsythia St
- 327 S 46th St
- 443 S 43rd St
- 4457 Aster St
- 4833 Daisy St
- 4883 Elderberry Loop
- 4217 Cole Way
- 4131 Forsythia St
- 0 Filbert Ln
- 4187 Richland St
- 5284 Cedar View Dr
- 5254 Cedar View Dr
- 5124 Cedar View Dr
- 877 S 45th Place
- 857 S 45th Place
- 870 S 46th St
- 866 S 46th St
- 888 S 46th St
- 858 S 46th St
- 889 S 45th Place
- 841 S 45th Place
- 862 S 45th Place
- 880 S 45th Place
- 4590 Holly St
- 842 S 46th St
- 4550 Holly St
- 830 S 45th Place
- 858 S 45th Place
- 844 S 45th Place
- 834 S 46th St
- 871 S 46th St
- 4536 Holly St
- 863 S 46th St