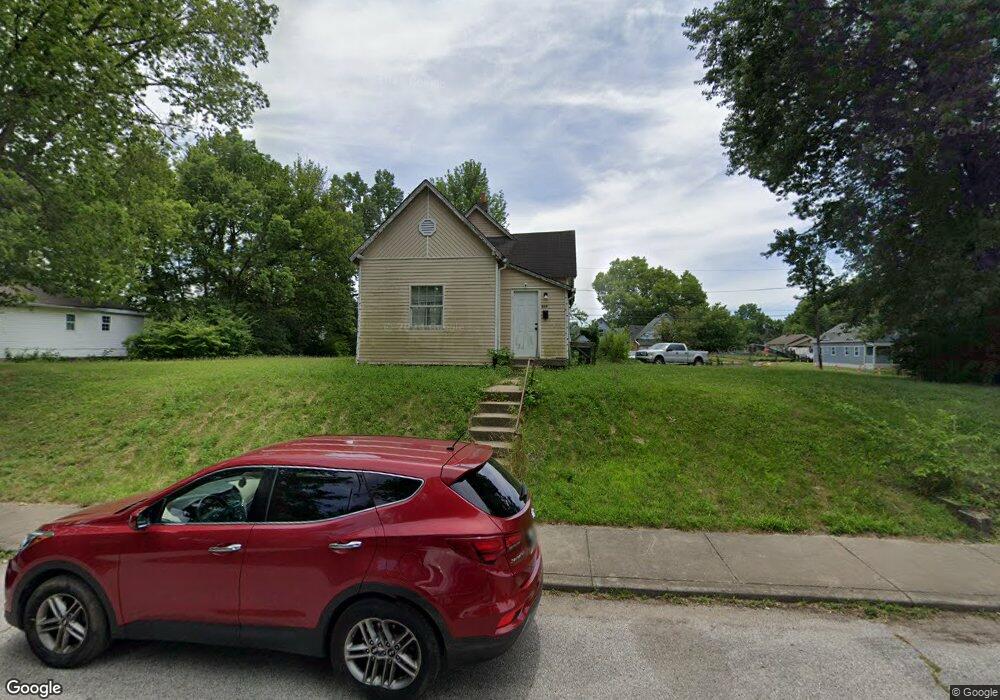
869 W 26th St Indianapolis, IN 46208
Near Northwest Riverside NeighborhoodEstimated Value: $111,000 - $122,000
3
Beds
1
Bath
846
Sq Ft
$134/Sq Ft
Est. Value
About This Home
This home is located at 869 W 26th St, Indianapolis, IN 46208 and is currently estimated at $113,783, approximately $134 per square foot. 869 W 26th St is a home located in Marion County with nearby schools including Elder W. Diggs School 42, James Whitcomb Riley School 43, and Carl Wilde School 79.
Ownership History
Date
Name
Owned For
Owner Type
Purchase Details
Closed on
Oct 18, 2013
Sold by
Marion County Auditor
Bought by
Marion County
Current Estimated Value
Purchase Details
Closed on
Jun 2, 2010
Sold by
Mcfadden Shaun
Bought by
Kai Holdings Llc
Purchase Details
Closed on
Jul 22, 2005
Sold by
Abn Amro Mortgage Group Inc
Bought by
Mcfadden Shaun
Purchase Details
Closed on
Mar 15, 2005
Sold by
Federal Home Loan Mortgage Corporation
Bought by
Abn Amro Mortgagej Group Inc
Create a Home Valuation Report for This Property
The Home Valuation Report is an in-depth analysis detailing your home's value as well as a comparison with similar homes in the area
Home Values in the Area
Average Home Value in this Area
Purchase History
| Date | Buyer | Sale Price | Title Company |
|---|---|---|---|
| Marion County | $2,700 | -- | |
| Kai Holdings Llc | -- | None Available | |
| Mcfadden Shaun | -- | None Available | |
| Abn Amro Mortgagej Group Inc | -- | None Available |
Source: Public Records
Tax History Compared to Growth
Tax History
| Year | Tax Paid | Tax Assessment Tax Assessment Total Assessment is a certain percentage of the fair market value that is determined by local assessors to be the total taxable value of land and additions on the property. | Land | Improvement |
|---|---|---|---|---|
| 2024 | $1,179 | $51,300 | $9,600 | $41,700 |
| 2023 | $1,179 | $46,000 | $9,600 | $36,400 |
| 2022 | $1,099 | $46,000 | $9,600 | $36,400 |
| 2021 | $878 | $34,400 | $2,600 | $31,800 |
| 2020 | $805 | $31,200 | $2,600 | $28,600 |
| 2019 | $1,213 | $28,600 | $2,600 | $26,000 |
| 2018 | $562 | $20,300 | $2,600 | $17,700 |
| 2017 | $749 | $18,800 | $2,600 | $16,200 |
| 2016 | $826 | $18,200 | $2,600 | $15,600 |
| 2014 | $402 | $18,600 | $2,600 | $16,000 |
| 2013 | $518 | $22,400 | $2,600 | $19,800 |
Source: Public Records
Map
Nearby Homes