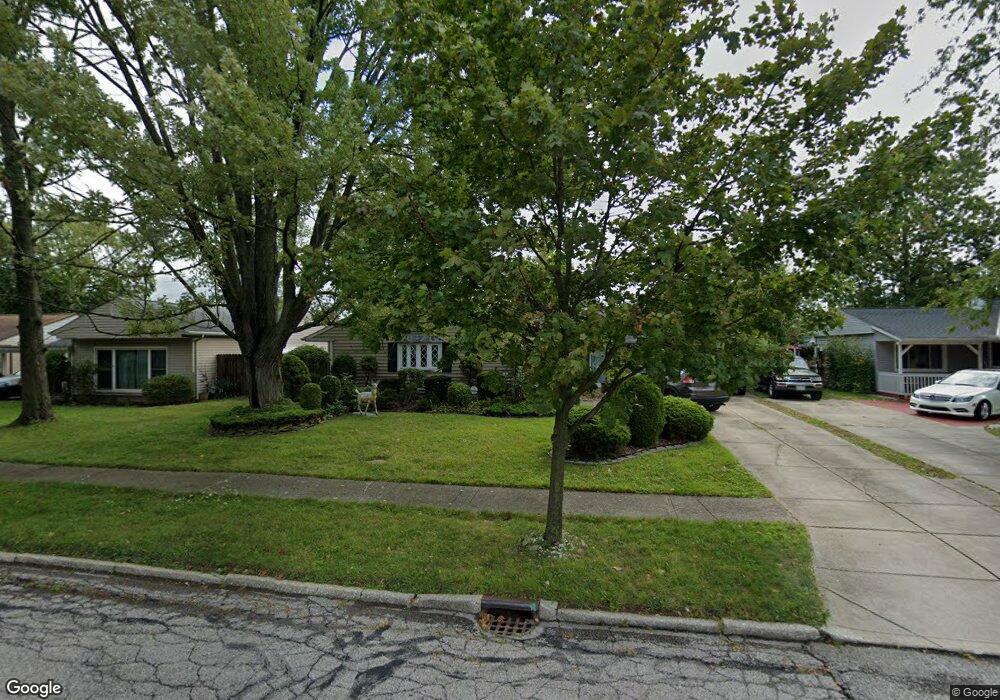
8695 Lynnhaven Rd Parma Heights, OH 44130
Estimated Value: $166,548 - $210,000
3
Beds
1
Bath
1,151
Sq Ft
$163/Sq Ft
Est. Value
About This Home
This home is located at 8695 Lynnhaven Rd, Parma Heights, OH 44130 and is currently estimated at $187,887, approximately $163 per square foot. 8695 Lynnhaven Rd is a home located in Cuyahoga County with nearby schools including Greenbriar Middle School, Pleasant Valley Elementary School, and Valley Forge High School.
Ownership History
Date
Name
Owned For
Owner Type
Purchase Details
Closed on
Nov 12, 2008
Sold by
The Walkush Group Llc
Bought by
Arlotto Theodore
Current Estimated Value
Purchase Details
Closed on
Sep 30, 2002
Sold by
Cran William R and Cran Laverne M
Bought by
Martin Frank and Martin Carolyn M
Home Financials for this Owner
Home Financials are based on the most recent Mortgage that was taken out on this home.
Original Mortgage
$97,600
Interest Rate
6.39%
Purchase Details
Closed on
Jul 19, 1977
Sold by
Neuber Bernard G
Bought by
Cran William R
Purchase Details
Closed on
Apr 8, 1976
Sold by
Mccarthy Robert G and Mccarthy Susan
Bought by
Neuber Bernard G
Purchase Details
Closed on
Jan 1, 1975
Bought by
Mccarthy Robert G and Mccarthy Susan
Create a Home Valuation Report for This Property
The Home Valuation Report is an in-depth analysis detailing your home's value as well as a comparison with similar homes in the area
Home Values in the Area
Average Home Value in this Area
Purchase History
| Date | Buyer | Sale Price | Title Company |
|---|---|---|---|
| Arlotto Theodore | $75,000 | Emerald Glen Title Agency | |
| The Walkush Group Llc | $60,000 | Emerald Glen Title Agency | |
| Martin Frank | $122,000 | All Ohio Title Agency Inc | |
| Cran William R | $39,500 | -- | |
| Neuber Bernard G | $34,500 | -- | |
| Mccarthy Robert G | -- | -- |
Source: Public Records
Mortgage History
| Date | Status | Borrower | Loan Amount |
|---|---|---|---|
| Previous Owner | Martin Frank | $97,600 | |
| Closed | Martin Frank | $24,400 |
Source: Public Records
Tax History
| Year | Tax Paid | Tax Assessment Tax Assessment Total Assessment is a certain percentage of the fair market value that is determined by local assessors to be the total taxable value of land and additions on the property. | Land | Improvement |
|---|---|---|---|---|
| 2025 | $3,055 | $48,895 | $9,975 | $38,920 |
| 2024 | $3,227 | $48,895 | $9,975 | $38,920 |
| 2023 | $2,857 | $37,210 | $7,910 | $29,300 |
| 2022 | $2,842 | $37,210 | $7,910 | $29,300 |
| 2021 | $2,841 | $37,210 | $7,910 | $29,300 |
| 2020 | $2,569 | $30,000 | $6,370 | $23,630 |
| 2019 | $2,502 | $85,700 | $18,200 | $67,500 |
| 2018 | $2,445 | $30,000 | $6,370 | $23,630 |
| 2017 | $2,395 | $26,780 | $4,940 | $21,840 |
| 2016 | $2,378 | $26,780 | $4,940 | $21,840 |
| 2015 | $2,455 | $26,780 | $4,940 | $21,840 |
| 2014 | $2,455 | $27,900 | $5,150 | $22,750 |
Source: Public Records
Map
Nearby Homes
- 6526 Westminster Dr
- 6584 Westminster Dr
- 9019 Newkirk Dr
- 6494 S Canterbury Rd
- 6394 Westminster Dr
- 9248 Lynnhaven Rd
- 9300 Manorford Dr
- 6329 Nelwood Rd
- 8409 Wainstead Dr
- 6392 Doncaster Ave
- 9474 Stoney Creek Ln
- 8208 Wainstead Dr
- 9913 Manorford Dr
- 8325 Kenton Ave
- 6787 Anthony Ln
- 6370 Manchester Rd
- 7906 Kenton Ave
- 6429 Aylesworth Dr
- 6220 Denison Blvd
- 8318 Lanyard Dr
- 8693 Lynnhaven Rd
- 8697 Lynnhaven Rd
- 8691 Lynnhaven Rd
- 8699 Lynnhaven Rd
- 6530 Westminster Dr
- 6534 Westminster Dr
- 6538 Westminster Dr
- 6522 Westminster Dr
- 6542 Westminster Dr
- 8694 Lynnhaven Rd
- 8689 Lynnhaven Rd
- 6518 Westminster Dr
- 6546 Westminster Dr
- 8701 Lynnhaven Rd
- 8698 Lynnhaven Rd
- 8692 Lynnhaven Rd
- 6514 Westminster Dr
- 6550 Westminster Dr
- 8700 Lynnhaven Rd
- 8687 Lynnhaven Rd
Your Personal Tour Guide
Ask me questions while you tour the home.