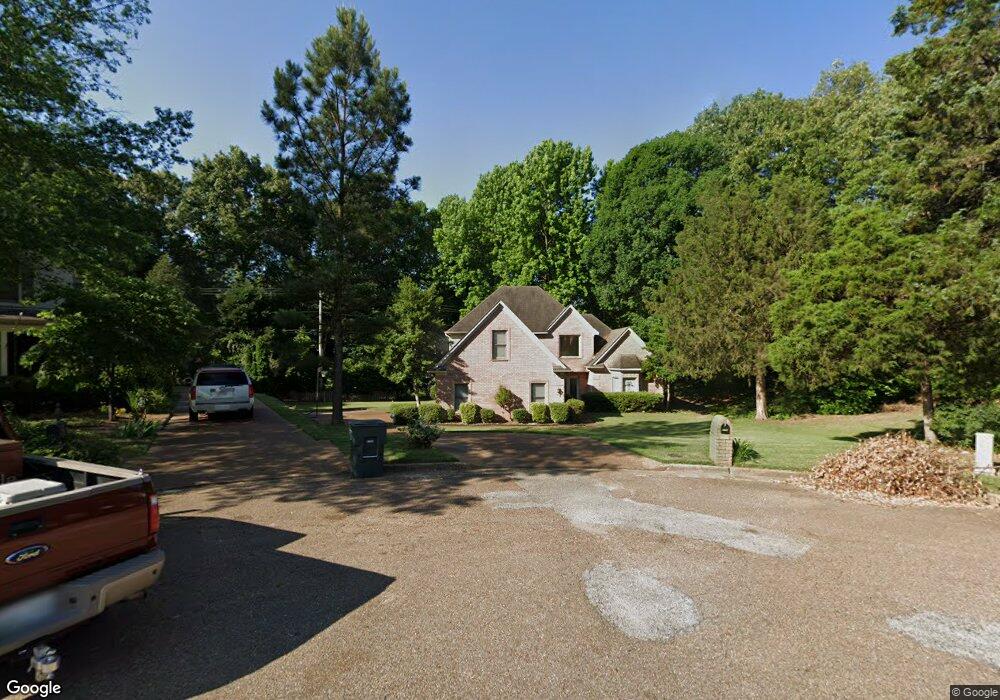
8699 Haystack Cove Cordova, TN 38016
Cordova NeighborhoodEstimated Value: $353,000 - $461,000
4
Beds
4
Baths
4,063
Sq Ft
$99/Sq Ft
Est. Value
About This Home
This home is located at 8699 Haystack Cove, Cordova, TN 38016 and is currently estimated at $403,792, approximately $99 per square foot. 8699 Haystack Cove is a home located in Shelby County with nearby schools including Riverwood Elementary School, Cordova High School, and Cordova Middle School.
Ownership History
Date
Name
Owned For
Owner Type
Purchase Details
Closed on
Jun 27, 2007
Sold by
Wells Fargo Financial Tennessee 1 Llc
Bought by
Mcnealy Ronald and Mcnealy Darlene
Current Estimated Value
Home Financials for this Owner
Home Financials are based on the most recent Mortgage that was taken out on this home.
Original Mortgage
$199,940
Outstanding Balance
$123,987
Interest Rate
6.35%
Mortgage Type
Purchase Money Mortgage
Estimated Equity
$279,805
Purchase Details
Closed on
Sep 6, 2006
Sold by
Surrett Michael L and Surrett Robin L
Bought by
Wells Fargo Financial Tennessee 1 Llc
Purchase Details
Closed on
Dec 19, 2003
Sold by
Zelensky Nicholas E
Bought by
Surrett Michael L and Surrett Robin L
Home Financials for this Owner
Home Financials are based on the most recent Mortgage that was taken out on this home.
Original Mortgage
$188,700
Interest Rate
5.82%
Mortgage Type
Purchase Money Mortgage
Create a Home Valuation Report for This Property
The Home Valuation Report is an in-depth analysis detailing your home's value as well as a comparison with similar homes in the area
Home Values in the Area
Average Home Value in this Area
Purchase History
| Date | Buyer | Sale Price | Title Company |
|---|---|---|---|
| Mcnealy Ronald | $199,947 | Alliance Title | |
| Wells Fargo Financial Tennessee 1 Llc | $220,000 | None Available | |
| Surrett Michael L | $222,000 | -- |
Source: Public Records
Mortgage History
| Date | Status | Borrower | Loan Amount |
|---|---|---|---|
| Open | Mcnealy Ronald | $199,940 | |
| Previous Owner | Surrett Michael L | $188,700 |
Source: Public Records
Tax History Compared to Growth
Tax History
| Year | Tax Paid | Tax Assessment Tax Assessment Total Assessment is a certain percentage of the fair market value that is determined by local assessors to be the total taxable value of land and additions on the property. | Land | Improvement |
|---|---|---|---|---|
| 2025 | $2,626 | $101,050 | $18,625 | $82,425 |
| 2024 | $2,626 | $77,475 | $12,650 | $64,825 |
| 2023 | $4,720 | $77,475 | $12,650 | $64,825 |
| 2022 | $4,720 | $77,475 | $12,650 | $64,825 |
| 2021 | $4,775 | $77,475 | $12,650 | $64,825 |
| 2020 | $4,505 | $62,175 | $12,650 | $49,525 |
| 2019 | $4,505 | $62,175 | $12,650 | $49,525 |
| 2018 | $4,505 | $62,175 | $12,650 | $49,525 |
| 2017 | $2,555 | $62,175 | $12,650 | $49,525 |
| 2016 | $2,299 | $52,600 | $0 | $0 |
| 2014 | $2,299 | $52,600 | $0 | $0 |
Source: Public Records
Map
Nearby Homes
- 8672 Cedar Farms Dr
- 1561 Cedar Farms Cove
- 8686 Cedar Farms Dr
- 1636 Stablemill Cove
- 8668 Stablemill Ln
- 8660 Cedar Trails Dr
- 1520 Wood Farms Dr
- 8620 Stablemill Ln
- 8756 Riverwood Farms Pkwy
- 1620 Saddle Chase Cove
- 8656 Wood Mills Dr W
- 8860 Toth Cove
- 1770 Mill Glen Cove
- 8879 Chimneyrock Blvd
- 1626 Raybrad Dr
- 8925 Cedar Mills Cove
- 8805 River Rise Dr
- 1700 Belledeer Dr W
- 8920 Rowley Cove
- 1341 Cedar Hollow Dr
- 1608 Stable Park Ct
- 8705 Haystack Cove
- 8693 Haystack Cove
- 8706 Haystack Cove
- 8680 Cedar Farms Dr
- 1559 Cedar Farms Cove
- 8696 Haystack Cove
- 8690 Haystack Cove
- 8664 Cedar Farms Dr
- 1599 Saddle Glen Cove
- 1565 Cedar Farms Cove
- 1594 Stable Park Ct
- 1555 Cedar Farms Cove
- 1607 Saddle Glen Cove
- 1617 Stable Park Ct
- 1605 Stable Park Ct
- 1615 Saddle Glen Cove
- 8709 Stablemill Ln
- 1627 Stable Park Ct
- 8656 Cedar Farms Dr