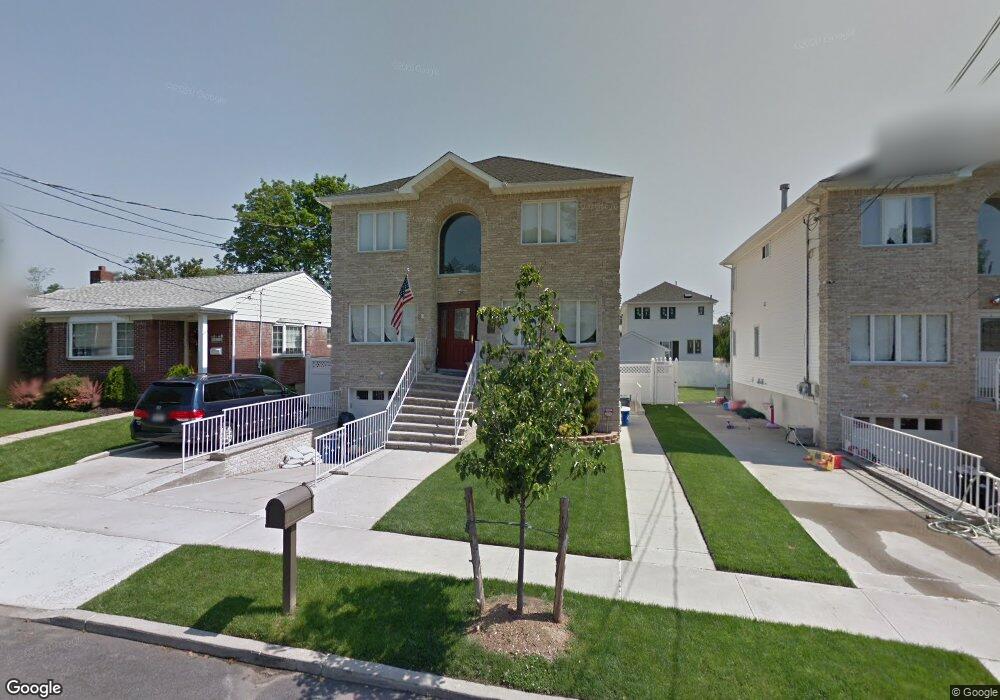
87 Alter Ave Staten Island, NY 10304
Dongan Hills NeighborhoodEstimated Value: $1,003,000 - $1,465,916
4
Beds
4
Baths
2,700
Sq Ft
$460/Sq Ft
Est. Value
About This Home
This home is located at 87 Alter Ave, Staten Island, NY 10304 and is currently estimated at $1,242,729, approximately $460 per square foot. 87 Alter Ave is a home located in Richmond County with nearby schools including P.S. 11 Thomas Dongan School, Is 2 George L Egbert, and New Dorp High School.
Ownership History
Date
Name
Owned For
Owner Type
Purchase Details
Closed on
Jul 15, 2024
Sold by
Sciortino Anthony
Bought by
Sciortino Santino
Current Estimated Value
Purchase Details
Closed on
Nov 13, 2007
Sold by
Palermo Construction Corp
Bought by
Sciortino Santino and Sciortino Anthony
Home Financials for this Owner
Home Financials are based on the most recent Mortgage that was taken out on this home.
Original Mortgage
$66,200
Interest Rate
6.48%
Mortgage Type
Stand Alone Second
Create a Home Valuation Report for This Property
The Home Valuation Report is an in-depth analysis detailing your home's value as well as a comparison with similar homes in the area
Home Values in the Area
Average Home Value in this Area
Purchase History
| Date | Buyer | Sale Price | Title Company |
|---|---|---|---|
| Sciortino Santino | -- | Commonwealth Land Title | |
| Sciortino Santino | $814,600 | None Available | |
| Palermo Construction Corp | $480,000 | None Available |
Source: Public Records
Mortgage History
| Date | Status | Borrower | Loan Amount |
|---|---|---|---|
| Previous Owner | Palermo Construction Corp | $66,200 | |
| Previous Owner | Sciortino Santino | $533,850 |
Source: Public Records
Tax History Compared to Growth
Tax History
| Year | Tax Paid | Tax Assessment Tax Assessment Total Assessment is a certain percentage of the fair market value that is determined by local assessors to be the total taxable value of land and additions on the property. | Land | Improvement |
|---|---|---|---|---|
| 2025 | $11,419 | $75,900 | $19,865 | $56,035 |
| 2024 | $11,419 | $78,420 | $18,138 | $60,282 |
| 2023 | $11,197 | $55,133 | $18,174 | $36,959 |
| 2022 | $10,383 | $75,420 | $25,020 | $50,400 |
| 2021 | $10,946 | $62,460 | $25,020 | $37,440 |
| 2020 | $10,630 | $67,680 | $25,020 | $42,660 |
| 2019 | $9,911 | $64,740 | $25,020 | $39,720 |
| 2018 | $9,366 | $45,944 | $24,689 | $21,255 |
| 2017 | $8,836 | $43,344 | $21,568 | $21,776 |
| 2016 | $8,665 | $43,344 | $21,962 | $21,382 |
| 2015 | $7,577 | $41,848 | $25,294 | $16,554 |
| 2014 | $7,577 | $39,480 | $27,780 | $11,700 |
Source: Public Records
Map
Nearby Homes
- 91 Alter Ave
- 82 Delaware Ave
- 90 Alter Ave
- 65 Alter Ave
- 119 Raritan Ave
- 137 Delaware Ave
- 163 Cromwell Ave Unit 3B
- 165 Cromwell Ave Unit 3C
- 34 Bear St
- 0 Richmond Rd
- 76 Jefferson St
- 102 Burgher Ave
- 17 Sabrina Ln
- 11 Norden St
- 22 Delaware St
- 1373 Richmond Rd
- 107 Jefferson St
- 120 Overlook Ave
- 169 Atlantic Ave
- 70 Jenna Ln