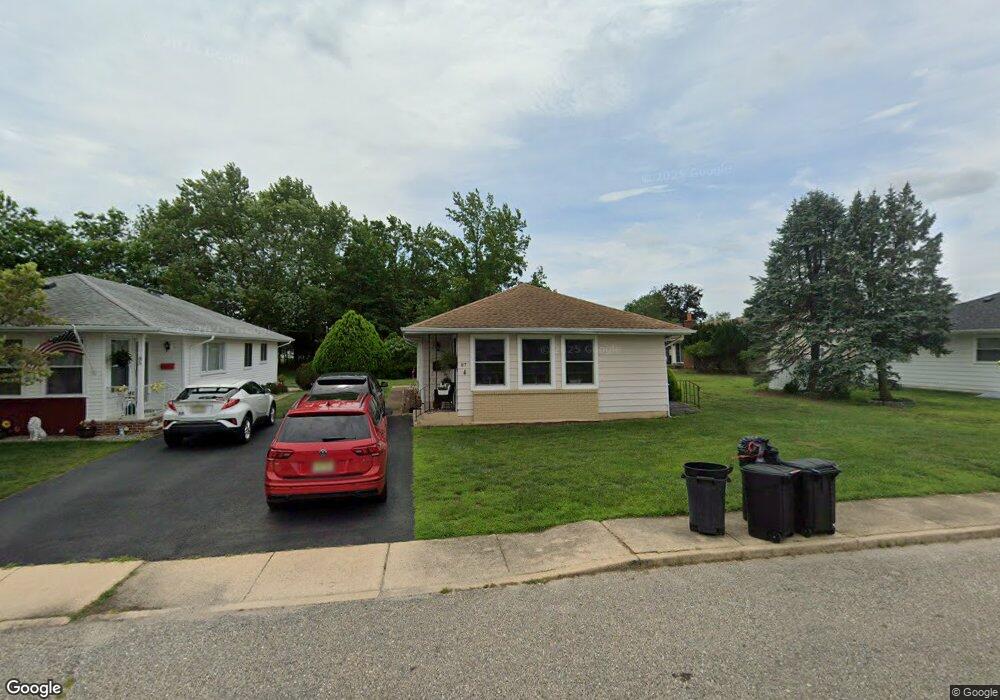
87 Barbuda St Toms River, NJ 08757
Estimated Value: $215,000 - $302,000
2
Beds
1
Bath
1,126
Sq Ft
$232/Sq Ft
Est. Value
About This Home
This home is located at 87 Barbuda St, Toms River, NJ 08757 and is currently estimated at $261,201, approximately $231 per square foot. 87 Barbuda St is a home located in Ocean County with nearby schools including Central Regional Middle School, Central Regional High School, and St Joseph Grade School.
Ownership History
Date
Name
Owned For
Owner Type
Purchase Details
Closed on
Jul 24, 2023
Sold by
Monks James and Monks Kathy
Bought by
Desimone Dawn M
Current Estimated Value
Home Financials for this Owner
Home Financials are based on the most recent Mortgage that was taken out on this home.
Original Mortgage
$15,000
Interest Rate
1%
Purchase Details
Closed on
Dec 8, 2006
Sold by
Giordano Tom
Bought by
Monks James
Purchase Details
Closed on
Sep 1, 1993
Sold by
Costa Andrew
Bought by
Esposito Geraldine
Home Financials for this Owner
Home Financials are based on the most recent Mortgage that was taken out on this home.
Original Mortgage
$25,000
Interest Rate
7.1%
Create a Home Valuation Report for This Property
The Home Valuation Report is an in-depth analysis detailing your home's value as well as a comparison with similar homes in the area
Home Values in the Area
Average Home Value in this Area
Purchase History
| Date | Buyer | Sale Price | Title Company |
|---|---|---|---|
| Desimone Dawn M | $175,000 | Westcor Land Title | |
| Desimone Dawn M | $175,000 | Westcor Land Title | |
| Monks James | $110,000 | Ticor Title Insurance Co | |
| Esposito Geraldine | $52,000 | -- |
Source: Public Records
Mortgage History
| Date | Status | Borrower | Loan Amount |
|---|---|---|---|
| Closed | Desimone Dawn M | $15,000 | |
| Open | Desimone Dawn M | $171,830 | |
| Closed | Desimone Dawn M | $171,830 | |
| Previous Owner | Esposito Geraldine | $25,000 |
Source: Public Records
Tax History
| Year | Tax Paid | Tax Assessment Tax Assessment Total Assessment is a certain percentage of the fair market value that is determined by local assessors to be the total taxable value of land and additions on the property. | Land | Improvement |
|---|---|---|---|---|
| 2025 | $2,626 | $101,400 | $30,000 | $71,400 |
| 2024 | $2,352 | $101,400 | $30,000 | $71,400 |
| 2023 | $2,309 | $101,400 | $30,000 | $71,400 |
| 2022 | $2,309 | $101,400 | $30,000 | $71,400 |
| 2021 | $2,256 | $101,400 | $30,000 | $71,400 |
| 2020 | $2,260 | $101,400 | $30,000 | $71,400 |
| 2019 | $2,197 | $101,400 | $30,000 | $71,400 |
| 2018 | $2,190 | $101,400 | $30,000 | $71,400 |
| 2017 | $2,109 | $101,400 | $30,000 | $71,400 |
| 2016 | $2,098 | $101,400 | $30,000 | $71,400 |
| 2015 | $2,040 | $101,400 | $30,000 | $71,400 |
| 2014 | $1,982 | $101,400 | $30,000 | $71,400 |
Source: Public Records
Map
Nearby Homes
- 82 Barbuda St
- 27 Montserrat St
- 321 Curacao St
- 503 Jamaica Blvd
- 151 Guadeloupe Dr
- 25 Saint Martin Place
- 16 Bolans Ct
- 7 Frederiksted St
- 336 Saint Thomas Dr
- 477 Jamaica Blvd
- 86 Northumberland Dr
- 24 Frederiksted St
- 79 Guadeloupe Dr
- 34 Barbuda St
- 61 Falmouth St
- 65 Northumberland Dr
- 7 Georgetown Dr
- 12 Ely Ct
- 62 Scarborough Place
- 9 Carlisle Rd
Your Personal Tour Guide
Ask me questions while you tour the home.