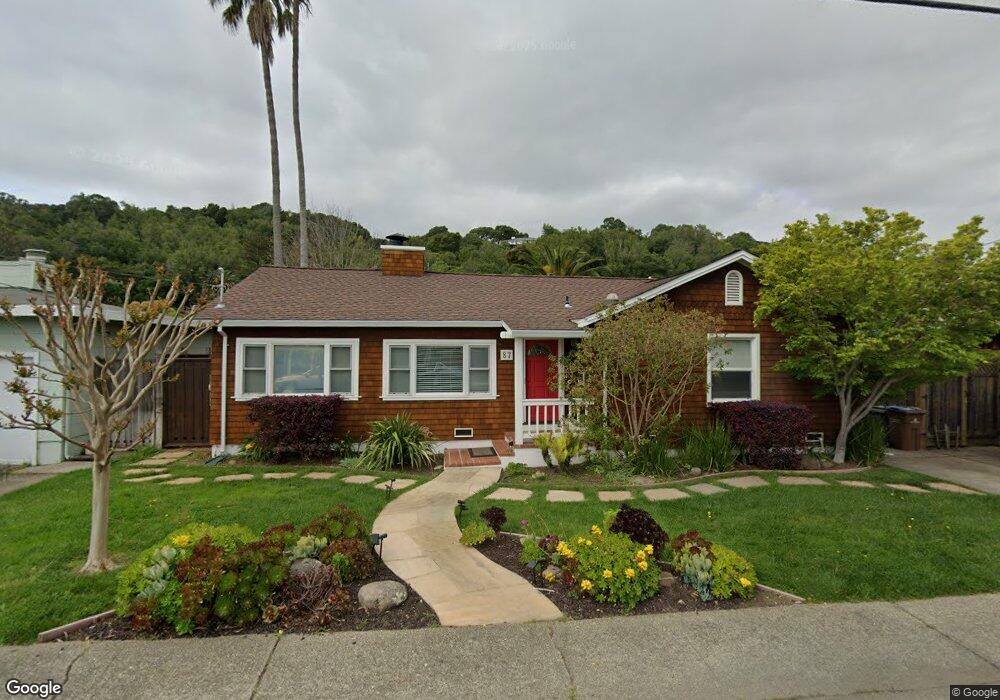
87 Billou St San Rafael, CA 94901
Picnic Valley NeighborhoodEstimated Value: $1,045,267 - $1,193,000
3
Beds
2
Baths
1,514
Sq Ft
$738/Sq Ft
Est. Value
About This Home
This home is located at 87 Billou St, San Rafael, CA 94901 and is currently estimated at $1,117,567, approximately $738 per square foot. 87 Billou St is a home located in Marin County with nearby schools including Laurel Dell Elementary School, Coleman Elementary School, and James B. Davidson Middle School.
Ownership History
Date
Name
Owned For
Owner Type
Purchase Details
Closed on
Dec 18, 2018
Sold by
Rogers Sherry N and Sherry Rogers Trust
Bought by
Fenger Kathryn Ann and Rogers Sherry N
Current Estimated Value
Purchase Details
Closed on
Apr 3, 2001
Sold by
Rogers Sherry N
Bought by
Rogers Sherry N
Purchase Details
Closed on
Mar 25, 1998
Sold by
Rogers Sherry N
Bought by
Rogers Sherry N
Home Financials for this Owner
Home Financials are based on the most recent Mortgage that was taken out on this home.
Original Mortgage
$145,000
Interest Rate
6.58%
Purchase Details
Closed on
Nov 14, 1996
Sold by
Rogers Douglas E
Bought by
Rogers Sherry N
Purchase Details
Closed on
Jan 27, 1994
Sold by
Rogers Sherry N
Bought by
Rogers Douglas E and Rogers Sherry N
Create a Home Valuation Report for This Property
The Home Valuation Report is an in-depth analysis detailing your home's value as well as a comparison with similar homes in the area
Home Values in the Area
Average Home Value in this Area
Purchase History
| Date | Buyer | Sale Price | Title Company |
|---|---|---|---|
| Fenger Kathryn Ann | -- | None Available | |
| Rogers Sherry N | -- | -- | |
| Rogers Sherry N | -- | First American Title Co | |
| Rogers Sherry N | -- | -- | |
| Rogers Douglas E | -- | -- |
Source: Public Records
Mortgage History
| Date | Status | Borrower | Loan Amount |
|---|---|---|---|
| Closed | Rogers Sherry N | $145,000 |
Source: Public Records
Tax History Compared to Growth
Tax History
| Year | Tax Paid | Tax Assessment Tax Assessment Total Assessment is a certain percentage of the fair market value that is determined by local assessors to be the total taxable value of land and additions on the property. | Land | Improvement |
|---|---|---|---|---|
| 2025 | $5,967 | $329,927 | $136,656 | $193,271 |
| 2024 | $5,967 | $323,460 | $133,977 | $189,483 |
| 2023 | $5,803 | $317,119 | $131,351 | $185,768 |
| 2022 | $5,538 | $310,902 | $128,776 | $182,126 |
| 2021 | $5,452 | $304,806 | $126,251 | $178,555 |
| 2020 | $5,361 | $301,679 | $124,956 | $176,723 |
| 2019 | $5,108 | $295,764 | $122,506 | $173,258 |
| 2018 | $5,053 | $289,966 | $120,105 | $169,861 |
| 2017 | $4,885 | $284,281 | $117,750 | $166,531 |
| 2016 | $4,706 | $278,707 | $115,441 | $163,266 |
| 2015 | $4,503 | $274,521 | $113,707 | $160,814 |
| 2014 | $4,297 | $269,144 | $111,480 | $157,664 |
Source: Public Records
Map
Nearby Homes