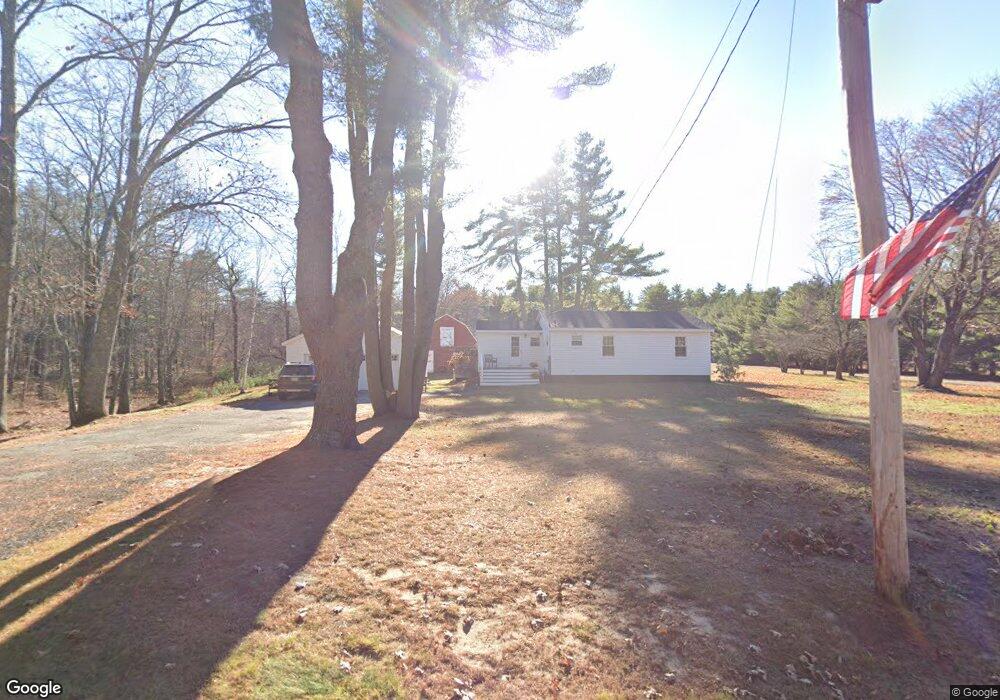
87 Buck St Gorham, ME 04038
Estimated Value: $392,301 - $455,000
2
Beds
1
Bath
1,192
Sq Ft
$354/Sq Ft
Est. Value
About This Home
This home is located at 87 Buck St, Gorham, ME 04038 and is currently estimated at $422,075, approximately $354 per square foot. 87 Buck St is a home with nearby schools including Great Falls Elementary School, Gorham Middle School, and Gorham High School.
Ownership History
Date
Name
Owned For
Owner Type
Purchase Details
Closed on
Aug 13, 2020
Sold by
Melonie L Bennett Lt and Bennett
Bought by
Melonie L Bennett Lt and Bennett
Current Estimated Value
Purchase Details
Closed on
Mar 6, 2012
Sold by
Melonie B Doucette Lt and Bennett
Bought by
Melonie L Bennett Lt and Bennett
Purchase Details
Closed on
Jul 2, 2007
Sold by
Doucette Scott A and Doucette Melonie
Bought by
Melonie B Doucette Lt
Create a Home Valuation Report for This Property
The Home Valuation Report is an in-depth analysis detailing your home's value as well as a comparison with similar homes in the area
Home Values in the Area
Average Home Value in this Area
Purchase History
| Date | Buyer | Sale Price | Title Company |
|---|---|---|---|
| Melonie L Bennett Lt | -- | None Available | |
| Melonie L Bennett Lt | -- | None Available | |
| Melonie L Bennett Lt | -- | -- | |
| Melonie L Bennett Lt | -- | -- | |
| Melonie B Doucette Lt | -- | -- | |
| Melonie B Doucette Lt | -- | -- |
Source: Public Records
Mortgage History
| Date | Status | Borrower | Loan Amount |
|---|---|---|---|
| Open | Melonie B Doucette Lt | $13,000 | |
| Open | Melonie B Doucette Lt | $155,000 | |
| Closed | Melonie B Doucette Lt | $150,000 |
Source: Public Records
Tax History
| Year | Tax Paid | Tax Assessment Tax Assessment Total Assessment is a certain percentage of the fair market value that is determined by local assessors to be the total taxable value of land and additions on the property. | Land | Improvement |
|---|---|---|---|---|
| 2025 | $4,231 | $285,900 | $90,100 | $195,800 |
| 2024 | $4,203 | $285,900 | $90,100 | $195,800 |
| 2023 | $3,931 | $285,900 | $90,100 | $195,800 |
| 2022 | $3,674 | $285,900 | $90,100 | $195,800 |
| 2021 | $3,329 | $171,600 | $69,500 | $102,100 |
| 2020 | $3,260 | $171,600 | $69,500 | $102,100 |
| 2019 | $3,582 | $189,000 | $86,900 | $102,100 |
| 2018 | $3,440 | $189,000 | $86,900 | $102,100 |
| 2017 | $3,232 | $189,000 | $86,900 | $102,100 |
| 2016 | $3,215 | $189,100 | $87,000 | $102,100 |
| 2015 | $3,082 | $189,100 | $87,000 | $102,100 |
| 2014 | $3,129 | $179,800 | $90,600 | $89,200 |
| 2013 | $3,111 | $179,800 | $90,600 | $89,200 |
Source: Public Records
Map
Nearby Homes
- 4 Blueberry Ln Unit 4
- 42 Brandons Way
- 66 Ossipee Trail East Trail E
- 63 Ossipee Trail E
- 9 Dingley Spring Rd
- 696 Fort Hill Rd
- 27 Ossipee Trail E Unit 1
- 697 Fort Hill Rd
- 14 Eastern Ln
- LOT #34 Woodbrey Ln
- 29 Woodbrey Ln
- 31 Woodbrey Ln
- LOT #65 Eastern Ln
- 24 Eastern Ln
- LOT #6 Eastern Ln
- LOT #8 Eastern Ln
- 3 Cortland Place Unit 8
- 4 Cortland Place Unit 3
- 761 Fort Hill Rd
- 1 Cortland Place Unit 7
Your Personal Tour Guide
Ask me questions while you tour the home.