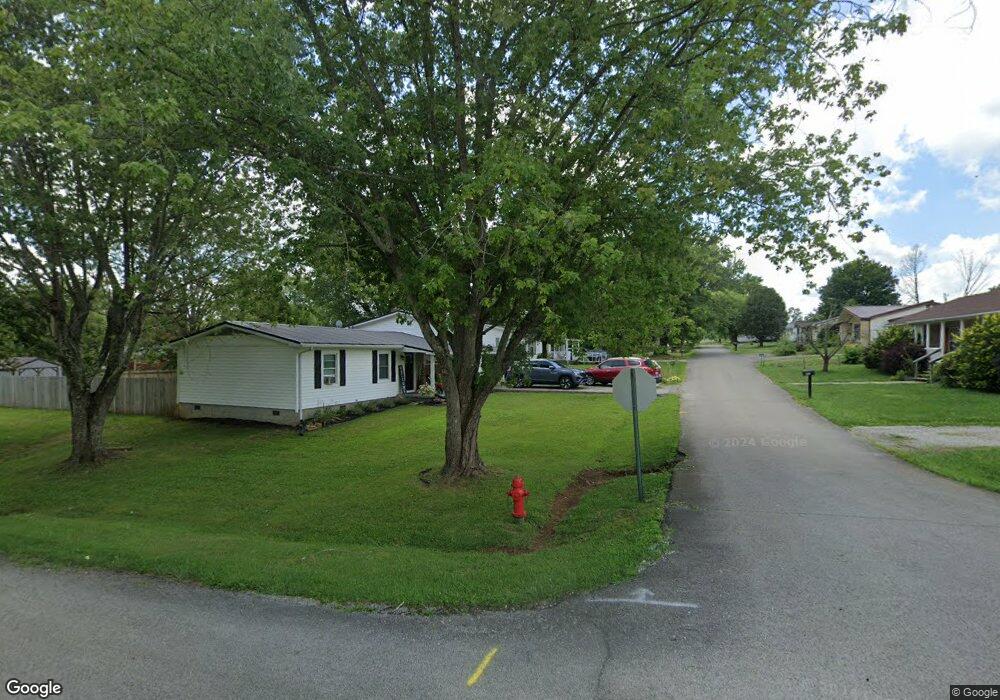
87 Chesley St West Union, OH 45693
Estimated Value: $116,064 - $153,000
3
Beds
1
Bath
960
Sq Ft
$143/Sq Ft
Est. Value
About This Home
This home is located at 87 Chesley St, West Union, OH 45693 and is currently estimated at $137,266, approximately $142 per square foot. 87 Chesley St is a home located in Adams County with nearby schools including West Union Elementary School, West Union High School, and Adams County Christian School.
Ownership History
Date
Name
Owned For
Owner Type
Purchase Details
Closed on
Aug 2, 2005
Sold by
Centex Home Equity Co Llc
Bought by
Jk Property Solutions Llc
Current Estimated Value
Purchase Details
Closed on
Mar 12, 2004
Sold by
Abbott David F
Bought by
Centex Home Equity
Purchase Details
Closed on
Jan 1, 1990
Bought by
Abbott David F
Create a Home Valuation Report for This Property
The Home Valuation Report is an in-depth analysis detailing your home's value as well as a comparison with similar homes in the area
Home Values in the Area
Average Home Value in this Area
Purchase History
| Date | Buyer | Sale Price | Title Company |
|---|---|---|---|
| Jk Property Solutions Llc | $35,000 | Sovereign Title Agency | |
| Centex Home Equity | -- | -- | |
| Abbott David F | -- | -- |
Source: Public Records
Tax History Compared to Growth
Tax History
| Year | Tax Paid | Tax Assessment Tax Assessment Total Assessment is a certain percentage of the fair market value that is determined by local assessors to be the total taxable value of land and additions on the property. | Land | Improvement |
|---|---|---|---|---|
| 2024 | $534 | $24,370 | $5,150 | $19,220 |
| 2023 | $280 | $24,370 | $5,150 | $19,220 |
| 2022 | $525 | $19,010 | $3,890 | $15,120 |
| 2021 | $373 | $19,010 | $3,890 | $15,120 |
| 2020 | $381 | $19,010 | $3,890 | $15,120 |
| 2019 | $381 | $19,010 | $3,890 | $15,120 |
| 2018 | $321 | $17,050 | $3,890 | $13,160 |
| 2017 | $316 | $17,050 | $3,890 | $13,160 |
| 2016 | $315 | $17,050 | $3,890 | $13,160 |
| 2015 | $277 | $16,280 | $4,030 | $12,250 |
| 2014 | $277 | $16,280 | $4,030 | $12,250 |
Source: Public Records
Map
Nearby Homes
- 120 Randy St
- 216 Kurt St
- 260 Randy St
- 1478 Robinson Hollow Rd
- 3188 Ohio 125
- 1082 E Walnut St
- 410 Owens Rd
- 618 Maple St
- 601 E Main St
- 917 Logans Ln
- 725 E Walnut St
- 501 E Mulberry St
- 526 E Walnut St
- 70 Logans Ln
- 104 N Washington St
- 175 Hidden Acres Dr
- 537 1st St
- 204 E North St
- 585 High St
- 12196 State Route 41