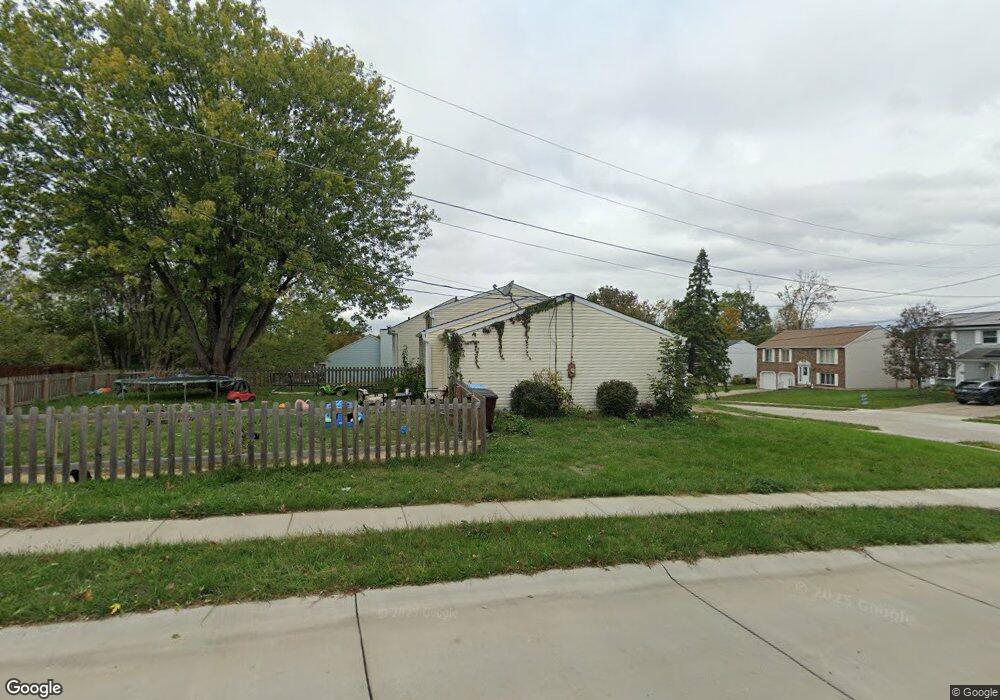
87 Delphi Dr Erlanger, KY 41018
Estimated Value: $227,385 - $235,000
3
Beds
2
Baths
900
Sq Ft
$255/Sq Ft
Est. Value
About This Home
This home is located at 87 Delphi Dr, Erlanger, KY 41018 and is currently estimated at $229,846, approximately $255 per square foot. 87 Delphi Dr is a home located in Kenton County with nearby schools including Caywood Elementary School, Dixie Heights High School, and Mary, Queen of Heaven School.
Ownership History
Date
Name
Owned For
Owner Type
Purchase Details
Closed on
Jul 25, 2007
Sold by
Dixon Preferred Properties Llc
Bought by
Lopez Mario Espina and Estrada Nancy
Current Estimated Value
Home Financials for this Owner
Home Financials are based on the most recent Mortgage that was taken out on this home.
Original Mortgage
$116,578
Outstanding Balance
$72,673
Interest Rate
6.63%
Mortgage Type
FHA
Estimated Equity
$157,173
Purchase Details
Closed on
Apr 13, 2007
Sold by
4U Properties Llc
Bought by
Dixon Preferred Properties Llc
Home Financials for this Owner
Home Financials are based on the most recent Mortgage that was taken out on this home.
Original Mortgage
$99,997
Interest Rate
6.1%
Mortgage Type
Purchase Money Mortgage
Purchase Details
Closed on
Apr 15, 2003
Sold by
Profant Michele A and Preston Kimberly L
Bought by
4U Properties Llc
Create a Home Valuation Report for This Property
The Home Valuation Report is an in-depth analysis detailing your home's value as well as a comparison with similar homes in the area
Home Values in the Area
Average Home Value in this Area
Purchase History
| Date | Buyer | Sale Price | Title Company |
|---|---|---|---|
| Lopez Mario Espina | $117,500 | Northern Kentucky Title Inc | |
| Dixon Preferred Properties Llc | $94,000 | Titlecare Closing Company | |
| 4U Properties Llc | -- | -- | |
| Profant Michele A | -- | -- |
Source: Public Records
Mortgage History
| Date | Status | Borrower | Loan Amount |
|---|---|---|---|
| Open | Lopez Mario Espina | $116,578 | |
| Previous Owner | Dixon Preferred Properties Llc | $99,997 |
Source: Public Records
Tax History
| Year | Tax Paid | Tax Assessment Tax Assessment Total Assessment is a certain percentage of the fair market value that is determined by local assessors to be the total taxable value of land and additions on the property. | Land | Improvement |
|---|---|---|---|---|
| 2025 | $1,656 | $167,100 | $25,000 | $142,100 |
| 2024 | $1,713 | $167,100 | $25,000 | $142,100 |
| 2023 | $1,781 | $167,100 | $25,000 | $142,100 |
| 2022 | $1,456 | $129,000 | $20,000 | $109,000 |
| 2021 | $1,485 | $129,000 | $20,000 | $109,000 |
| 2020 | $1,500 | $129,000 | $20,000 | $109,000 |
| 2019 | $1,378 | $117,500 | $20,000 | $97,500 |
| 2018 | $1,381 | $117,500 | $20,000 | $97,500 |
| 2017 | $1,269 | $117,500 | $20,000 | $97,500 |
| 2015 | $1,234 | $117,500 | $20,000 | $97,500 |
| 2014 | $1,213 | $117,500 | $20,000 | $97,500 |
Source: Public Records
Map
Nearby Homes
- 90 Delphi Dr
- 3323 Northway Dr
- 3312 Spring Valley Dr
- 3438 Cascade Ct
- HIALEAH Plan at Southwick - The Villas
- YAKIMA Plan at Southwick - The Villas
- KENAI Plan at Southwick - The Villas
- MCKENZIE Plan at Southwick - The Villas
- SARASOTA Plan at Southwick - The Villas
- HOLSTON Plan at Southwick - The Villas
- ALEXANDER Plan at Southwick - The Villas
- BOULDER Plan at Southwick - The Villas
- BEACHWOOD Plan at Southwick - The Villas
- NAPLES Plan at Southwick - The Villas
- PARKETTE Plan at Southwick - The Villas
- 4014 List Ct
- 931 Shadowridge Dr
- 1604 Raintree Ct
- 3310 Kingsburg Ct
- 69 Sagebrush Ln
- 91 Delphi Dr
- 95 Delphi Dr
- 117 Carriage Hill Dr
- 118 Carriage Hill Dr
- 116 Carriage Hill Dr
- 86 Delphi Dr
- 115 Carriage Hill Dr
- 94 Delphi Dr
- 82 Delphi Dr
- 99 Delphi Dr
- 112 Carriage Hill Dr
- 98 Delphi Dr
- 78 Delphi Dr
- 113 Carriage Hill Dr
- 74 Delphi Dr
- 103 Delphi Dr
- 110 Carriage Hill Dr
- 111 Carriage Hill Dr
- 71 Delphi Dr
- 106 Delphi Dr Unit 8