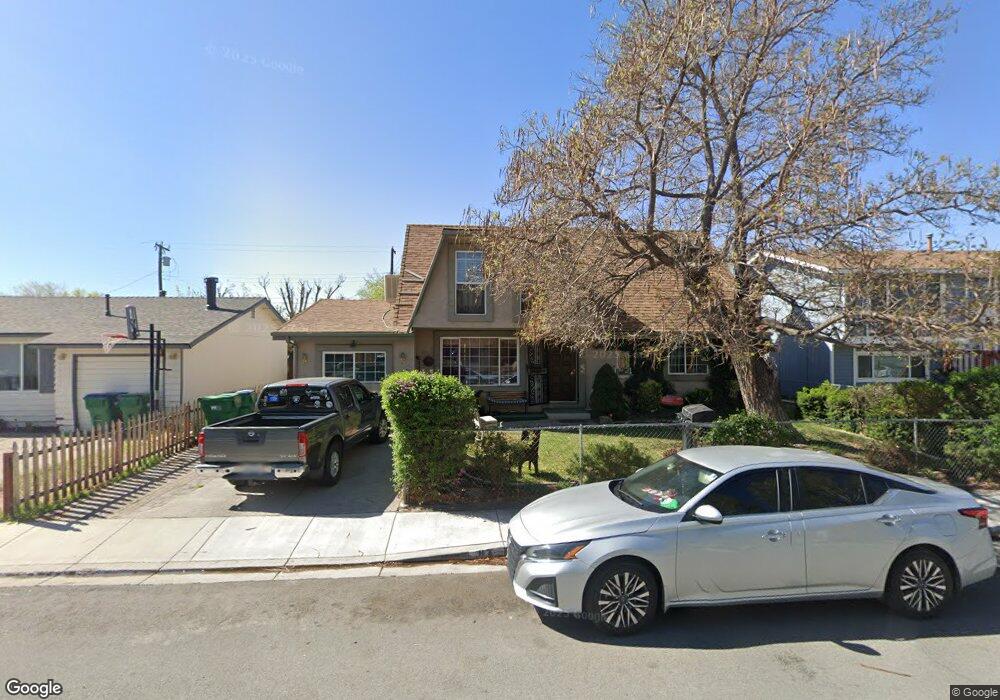
87 Gault Way Sparks, NV 89431
McCarran Boulevard-Probasco NeighborhoodEstimated Value: $413,000 - $464,000
4
Beds
2
Baths
1,536
Sq Ft
$287/Sq Ft
Est. Value
About This Home
This home is located at 87 Gault Way, Sparks, NV 89431 and is currently estimated at $441,537, approximately $287 per square foot. 87 Gault Way is a home located in Washoe County with nearby schools including Florence Drake Elementary School, George L Dilworth Middle School, and Sparks High School.
Ownership History
Date
Name
Owned For
Owner Type
Purchase Details
Closed on
Nov 3, 2014
Sold by
Deascencio Martha Vazquez
Bought by
Ascencio Perez Rodrigo
Current Estimated Value
Home Financials for this Owner
Home Financials are based on the most recent Mortgage that was taken out on this home.
Original Mortgage
$130,000
Outstanding Balance
$100,205
Interest Rate
4.17%
Mortgage Type
New Conventional
Estimated Equity
$341,332
Purchase Details
Closed on
Feb 20, 2003
Sold by
Thomas Sarita Schmorde and Thomas Sarita S
Bought by
Vazquez Ascencio Perez Rodrigo and Vazquez Deascencio Martha
Home Financials for this Owner
Home Financials are based on the most recent Mortgage that was taken out on this home.
Original Mortgage
$160,050
Interest Rate
5.89%
Purchase Details
Closed on
Oct 28, 1996
Sold by
Thomas Jon R
Bought by
Thomas Sarita Schmorde and Thomas Sarita S
Home Financials for this Owner
Home Financials are based on the most recent Mortgage that was taken out on this home.
Original Mortgage
$97,500
Interest Rate
8.11%
Create a Home Valuation Report for This Property
The Home Valuation Report is an in-depth analysis detailing your home's value as well as a comparison with similar homes in the area
Home Values in the Area
Average Home Value in this Area
Purchase History
| Date | Buyer | Sale Price | Title Company |
|---|---|---|---|
| Ascencio Perez Rodrigo | -- | First American Title | |
| Vazquez Ascencio Perez Rodrigo | $165,000 | Western Title Incorporated | |
| Thomas Sarita Schmorde | -- | First Centennial Title Co |
Source: Public Records
Mortgage History
| Date | Status | Borrower | Loan Amount |
|---|---|---|---|
| Open | Ascencio Perez Rodrigo | $130,000 | |
| Previous Owner | Vazquez Ascencio Perez Rodrigo | $160,050 | |
| Previous Owner | Thomas Sarita Schmorde | $97,500 |
Source: Public Records
Tax History Compared to Growth
Tax History
| Year | Tax Paid | Tax Assessment Tax Assessment Total Assessment is a certain percentage of the fair market value that is determined by local assessors to be the total taxable value of land and additions on the property. | Land | Improvement |
|---|---|---|---|---|
| 2025 | $1,228 | $58,295 | $33,565 | $24,730 |
| 2024 | $1,194 | $54,574 | $30,065 | $24,509 |
| 2023 | $1,194 | $54,056 | $31,325 | $22,731 |
| 2022 | $1,159 | $44,703 | $26,180 | $18,523 |
| 2021 | $1,125 | $35,901 | $17,955 | $17,946 |
| 2020 | $1,089 | $35,485 | $16,940 | $18,545 |
| 2019 | $1,063 | $34,449 | $15,890 | $18,559 |
| 2018 | $1,032 | $30,500 | $11,725 | $18,775 |
| 2017 | $1,006 | $29,836 | $10,395 | $19,441 |
| 2016 | $974 | $29,719 | $9,345 | $20,374 |
| 2015 | $971 | $28,632 | $7,700 | $20,932 |
| 2014 | $942 | $27,162 | $6,440 | $20,722 |
| 2013 | -- | $25,132 | $4,270 | $20,862 |
Source: Public Records
Map
Nearby Homes
- 119 Devere Way
- 10 Sheridan Way
- 120 E Lenwood Dr
- 465 Lenwood Dr
- 3245 Elaine Way
- 2865 Patrice Dr
- 3071 Meadowlands Dr
- 780 Emerson Way
- 3465 Dawn Cir
- 1940 4th St Unit 20
- 1940 4th St Unit 51
- 3104 Sandy St
- 1945 4th St Unit 32
- 1945 4th St Unit 33
- 1945 4th St Unit 10
- 1703 1st St
- 3545 4th St
- 8 E O St
- 3595 Rocky Ridge Ct
- 3607 Keogh Dr