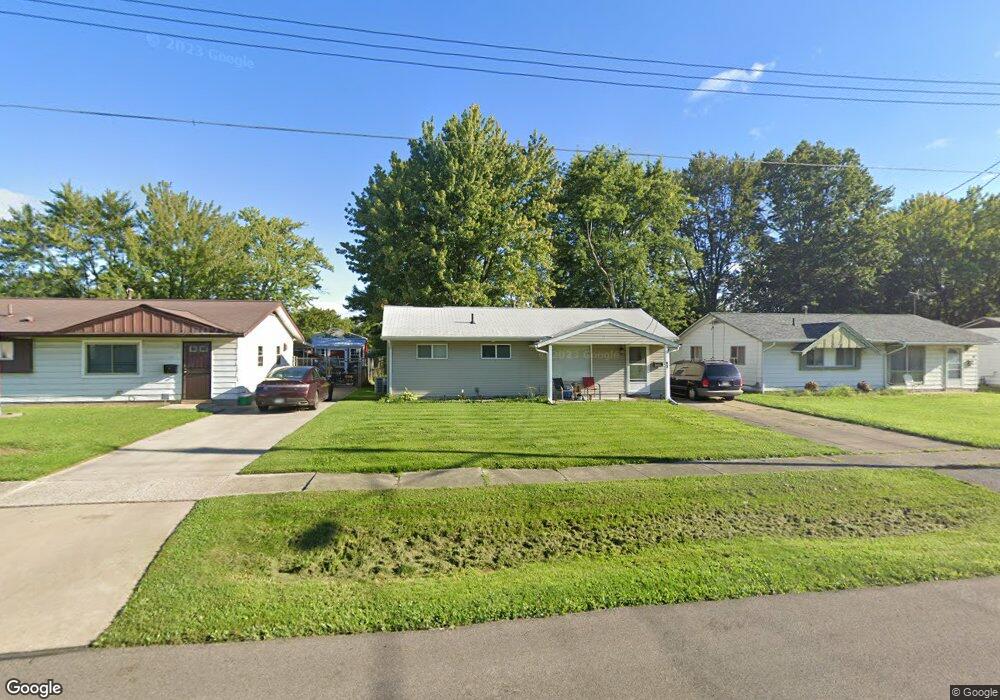
87 High St Elyria, OH 44035
Estimated Value: $95,000 - $119,163
3
Beds
1
Bath
912
Sq Ft
$121/Sq Ft
Est. Value
About This Home
This home is located at 87 High St, Elyria, OH 44035 and is currently estimated at $110,291, approximately $120 per square foot. 87 High St is a home located in Lorain County with nearby schools including Westwood Middle School, Elyria High School, and St Mary Elementary School.
Ownership History
Date
Name
Owned For
Owner Type
Purchase Details
Closed on
Apr 15, 2021
Sold by
Findley Dennis J and Findley Judith A
Bought by
Markel Joshua and Markel Michelle
Current Estimated Value
Purchase Details
Closed on
Sep 14, 2000
Sold by
Eaton Keith D
Bought by
Findley Dennis J and Findley Judy A
Home Financials for this Owner
Home Financials are based on the most recent Mortgage that was taken out on this home.
Original Mortgage
$64,800
Interest Rate
8.05%
Create a Home Valuation Report for This Property
The Home Valuation Report is an in-depth analysis detailing your home's value as well as a comparison with similar homes in the area
Home Values in the Area
Average Home Value in this Area
Purchase History
| Date | Buyer | Sale Price | Title Company |
|---|---|---|---|
| Markel Joshua | $68,000 | None Available | |
| Findley Dennis J | $72,000 | Express Title Services Of Oh |
Source: Public Records
Mortgage History
| Date | Status | Borrower | Loan Amount |
|---|---|---|---|
| Previous Owner | Findley Dennis J | $64,800 |
Source: Public Records
Tax History
| Year | Tax Paid | Tax Assessment Tax Assessment Total Assessment is a certain percentage of the fair market value that is determined by local assessors to be the total taxable value of land and additions on the property. | Land | Improvement |
|---|---|---|---|---|
| 2024 | $1,653 | $33,422 | $7,154 | $26,268 |
| 2023 | $1,069 | $18,708 | $3,966 | $14,742 |
| 2022 | $1,041 | $18,708 | $3,966 | $14,742 |
| 2021 | $1,044 | $18,708 | $3,966 | $14,742 |
| 2020 | $979 | $15,620 | $3,310 | $12,310 |
| 2019 | $973 | $15,620 | $3,310 | $12,310 |
| 2018 | $941 | $15,620 | $3,310 | $12,310 |
| 2017 | $875 | $12,930 | $3,110 | $9,820 |
| 2016 | $832 | $12,930 | $3,110 | $9,820 |
| 2015 | $780 | $12,930 | $3,110 | $9,820 |
| 2014 | $811 | $13,610 | $3,270 | $10,340 |
| 2013 | $805 | $13,610 | $3,270 | $10,340 |
Source: Public Records
Map
Nearby Homes
Your Personal Tour Guide
Ask me questions while you tour the home.