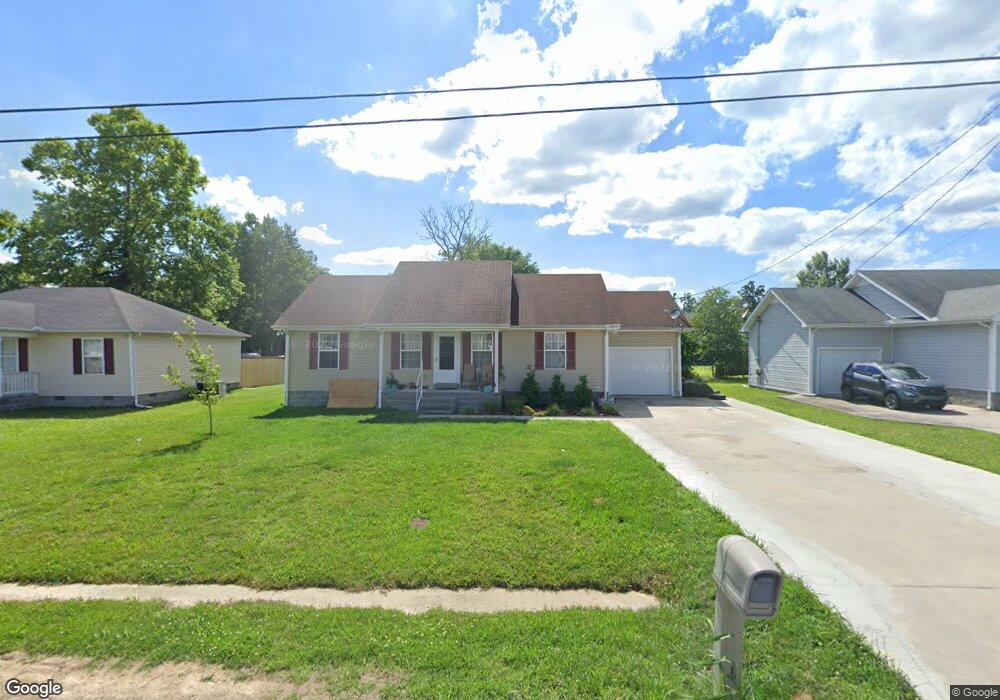
87 John Mark Ct Manchester, TN 37355
Estimated Value: $249,124 - $285,000
--
Bed
2
Baths
1,232
Sq Ft
$211/Sq Ft
Est. Value
About This Home
This home is located at 87 John Mark Ct, Manchester, TN 37355 and is currently estimated at $260,531, approximately $211 per square foot. 87 John Mark Ct is a home located in Coffee County with nearby schools including Westwood Middle School and Temple Baptist Christian School.
Ownership History
Date
Name
Owned For
Owner Type
Purchase Details
Closed on
Aug 7, 2020
Sold by
Rhoton Family Partnership
Bought by
Herrera Ignacio Silva and Pacheco Lizeth J
Current Estimated Value
Home Financials for this Owner
Home Financials are based on the most recent Mortgage that was taken out on this home.
Original Mortgage
$139,600
Outstanding Balance
$124,064
Interest Rate
3.1%
Mortgage Type
Unknown
Estimated Equity
$136,467
Purchase Details
Closed on
Mar 3, 2011
Sold by
Traders National Bank
Bought by
Rhoton Family Partnership
Home Financials for this Owner
Home Financials are based on the most recent Mortgage that was taken out on this home.
Original Mortgage
$70,125
Interest Rate
4.77%
Purchase Details
Closed on
Oct 30, 2008
Bought by
Gray Diane
Create a Home Valuation Report for This Property
The Home Valuation Report is an in-depth analysis detailing your home's value as well as a comparison with similar homes in the area
Home Values in the Area
Average Home Value in this Area
Purchase History
| Date | Buyer | Sale Price | Title Company |
|---|---|---|---|
| Herrera Ignacio Silva | $157,400 | None Available | |
| Rhoton Family Partnership | $82,500 | -- | |
| Gray Diane | $82,400 | -- |
Source: Public Records
Mortgage History
| Date | Status | Borrower | Loan Amount |
|---|---|---|---|
| Open | Herrera Ignacio Silva | $139,600 | |
| Previous Owner | Rhoton Family Partnership | $70,125 |
Source: Public Records
Tax History Compared to Growth
Tax History
| Year | Tax Paid | Tax Assessment Tax Assessment Total Assessment is a certain percentage of the fair market value that is determined by local assessors to be the total taxable value of land and additions on the property. | Land | Improvement |
|---|---|---|---|---|
| 2024 | $1,636 | $38,825 | $5,500 | $33,325 |
| 2023 | $1,636 | $38,825 | $0 | $0 |
| 2022 | $1,409 | $38,825 | $5,500 | $33,325 |
| 2021 | $1,301 | $28,400 | $3,000 | $25,400 |
| 2020 | $775 | $28,400 | $3,000 | $25,400 |
| 2019 | $1,301 | $28,400 | $3,000 | $25,400 |
| 2018 | $1,301 | $28,400 | $3,000 | $25,400 |
| 2017 | $1,328 | $25,325 | $3,000 | $22,325 |
| 2016 | $1,328 | $25,325 | $3,000 | $22,325 |
| 2015 | $1,328 | $25,325 | $3,000 | $22,325 |
| 2014 | $1,328 | $25,326 | $0 | $0 |
Source: Public Records
Map
Nearby Homes
- 564 Indian Springs Cir
- 538 Indian Springs Cir
- 600 Indian Springs Cir
- Lot 54 Interstate
- 310 Indian Springs Cir
- 913 Indian Springs Cir
- 0 Sherwood Dr
- 645 Doak Rd
- 874 Doak Rd
- 130 Brooklyn Ave
- 108 Belmar Cir
- 401 Doak Rd
- Lot 76 Philips
- 58 Brooklyn Ave
- 31 Brooklyn Ave
- 42 Brooklyn Ave
- 57 Brooklyn Ave
- 71 Brooklyn Ave
- 43 Brooklyn Ave
- 30 Brooklyn Ave
- 101 John Mark Ct
- 73 John Mark Ct
- 16 John Mark Ct
- 135 Chalet Dr
- 0 John Mark Ct
- 460 John Mark Ct
- 117 John Mark Ct
- 59 John Mark Ct
- 113 Chalet Dr
- 38 Swiss Dr
- 568 Indian Springs Cir
- 133 John Mark Ct
- 45 John Mark Ct
- 28 Brooke Ct
- 452 John Mark Ct
- 15 Brooke Ct
- 48 John Mark Ct
- 99 Chalet Dr
- 26 Swiss Dr
- 43 Swiss Dr