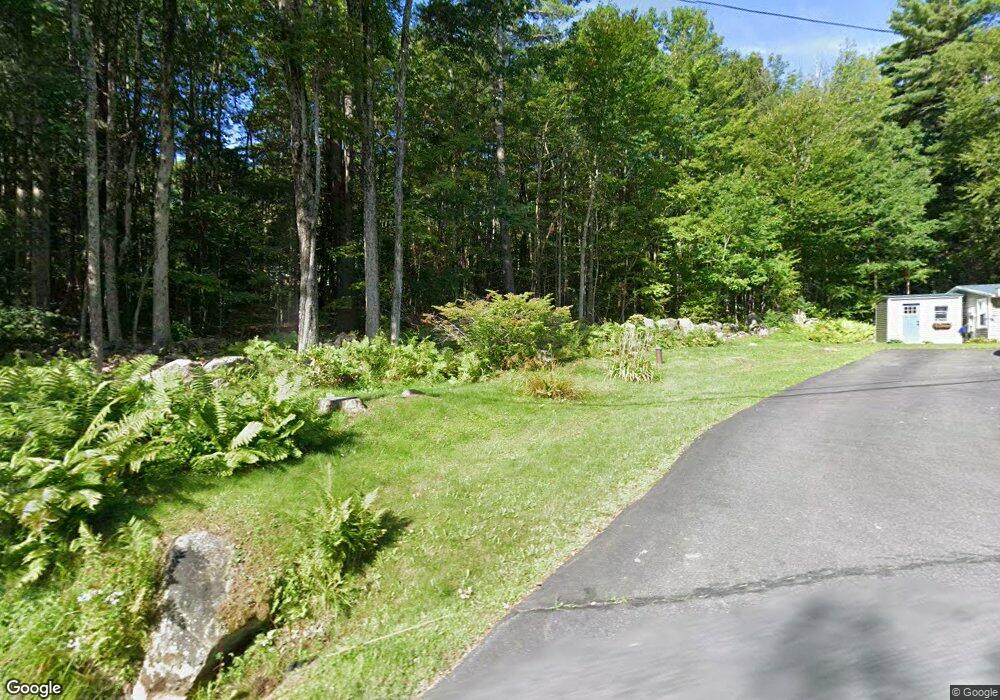
87 Lower Troy Rd Fitzwilliam, NH 03447
Estimated Value: $269,639 - $324,000
2
Beds
1
Bath
660
Sq Ft
$447/Sq Ft
Est. Value
About This Home
This home is located at 87 Lower Troy Rd, Fitzwilliam, NH 03447 and is currently estimated at $294,910, approximately $446 per square foot. 87 Lower Troy Rd is a home located in Cheshire County with nearby schools including Dr. George S. Emerson Elementary School and Monadnock Regional High School.
Ownership History
Date
Name
Owned For
Owner Type
Purchase Details
Closed on
Mar 27, 2024
Sold by
Bento Alisa
Bought by
Alisa R Bento Ret and Bento
Current Estimated Value
Purchase Details
Closed on
Feb 12, 2010
Sold by
Boisvert David J and Boisvert Suzanne M
Bought by
Bento Alisa
Home Financials for this Owner
Home Financials are based on the most recent Mortgage that was taken out on this home.
Original Mortgage
$88,836
Interest Rate
5.12%
Mortgage Type
Purchase Money Mortgage
Purchase Details
Closed on
Oct 30, 2009
Sold by
Savings Bank Of Walpol
Bought by
Boisvert David J and Boisvert Suzanne M
Purchase Details
Closed on
Oct 1, 2009
Sold by
Nichols Christin D and Howe Gerald A
Bought by
Savings Bank Of Walpol
Purchase Details
Closed on
Sep 4, 2007
Sold by
Cayea Kim A
Bought by
Nichols Christin D
Purchase Details
Closed on
Sep 3, 2002
Sold by
Royter Darrell W
Bought by
Cayea Kim A
Purchase Details
Closed on
Jun 2, 1999
Sold by
Cutting Gail I
Bought by
Royter Darrell W
Create a Home Valuation Report for This Property
The Home Valuation Report is an in-depth analysis detailing your home's value as well as a comparison with similar homes in the area
Home Values in the Area
Average Home Value in this Area
Purchase History
| Date | Buyer | Sale Price | Title Company |
|---|---|---|---|
| Alisa R Bento Ret | -- | None Available | |
| Alisa R Bento Ret | -- | None Available | |
| Bento Alisa | $85,000 | -- | |
| Bento Alisa | $85,000 | -- | |
| Boisvert David J | $36,000 | -- | |
| Boisvert David J | $36,000 | -- | |
| Savings Bank Of Walpol | $60,000 | -- | |
| Savings Bank Of Walpol | $60,000 | -- | |
| Nichols Christin D | $119,000 | -- | |
| Nichols Christin D | $119,000 | -- | |
| Cayea Kim A | $68,000 | -- | |
| Cayea Kim A | $68,000 | -- | |
| Royter Darrell W | $55,000 | -- | |
| Royter Darrell W | $55,000 | -- |
Source: Public Records
Mortgage History
| Date | Status | Borrower | Loan Amount |
|---|---|---|---|
| Previous Owner | Royter Darrell W | $88,836 |
Source: Public Records
Tax History Compared to Growth
Tax History
| Year | Tax Paid | Tax Assessment Tax Assessment Total Assessment is a certain percentage of the fair market value that is determined by local assessors to be the total taxable value of land and additions on the property. | Land | Improvement |
|---|---|---|---|---|
| 2024 | $3,334 | $182,500 | $74,900 | $107,600 |
| 2023 | $3,088 | $182,500 | $74,900 | $107,600 |
| 2022 | $2,995 | $182,500 | $74,900 | $107,600 |
| 2021 | $2,415 | $93,500 | $38,000 | $55,500 |
| 2020 | $2,409 | $93,500 | $38,000 | $55,500 |
| 2019 | $2,416 | $91,200 | $36,100 | $55,100 |
| 2018 | $0 | $91,200 | $36,100 | $55,100 |
| 2016 | $2,491 | $89,800 | $36,600 | $53,200 |
| 2015 | $2,399 | $89,800 | $36,600 | $53,200 |
| 2014 | $2,663 | $89,800 | $36,600 | $53,200 |
| 2013 | $2,545 | $89,800 | $36,600 | $53,200 |
Source: Public Records
Map
Nearby Homes
- 32/2-1 New Hampshire 119
- 9 Templeton Turnpike
- 117 Templeton Turnpike
- 206 New Hampshire 119
- 00 Scott Pond Rd
- 18 Lakeside Dr
- 34 E Lake Rd
- 314 Richmond Rd
- 125 Bowkerville Rd
- 310 Nh Route 119 E
- 376 South St Unit 1 Unit 1B
- 00 Fullam Hill Rd Unit 5, 6, 50
- 0 Quarry Rd Unit 2 4984313
- 319 W Lake Rd
- 33 S Main St Unit 18-0250
- 43 Carlotta Rd
- 24 Red Gate Rd
- 7 Woodland Park
- 617 Mountain Rd
- 5 Garden Way
- 5 Gap Mountain Rd
- 11 Kinsman Rd
- 78 Lower Troy Rd
- 97 Lower Troy Rd
- 12 Kinsman Rd
- 34 Robbins Rd
- 40 Robbins Rd
- 64 Lower Troy Rd
- 14 Gap Mountain Rd
- 35 Robbins Rd
- 147 Route 12 Route N
- 143 Highway 12
- 17 Robbins Rd
- LOT 3 Old Pierce Rd
- I-44 Club Dr
- LOT251 Plantation Way
- 20 Robbins Rd
- 25 Gap Mountain Rd
- 54 Robbins Rd
- 94 Upper Troy Rd