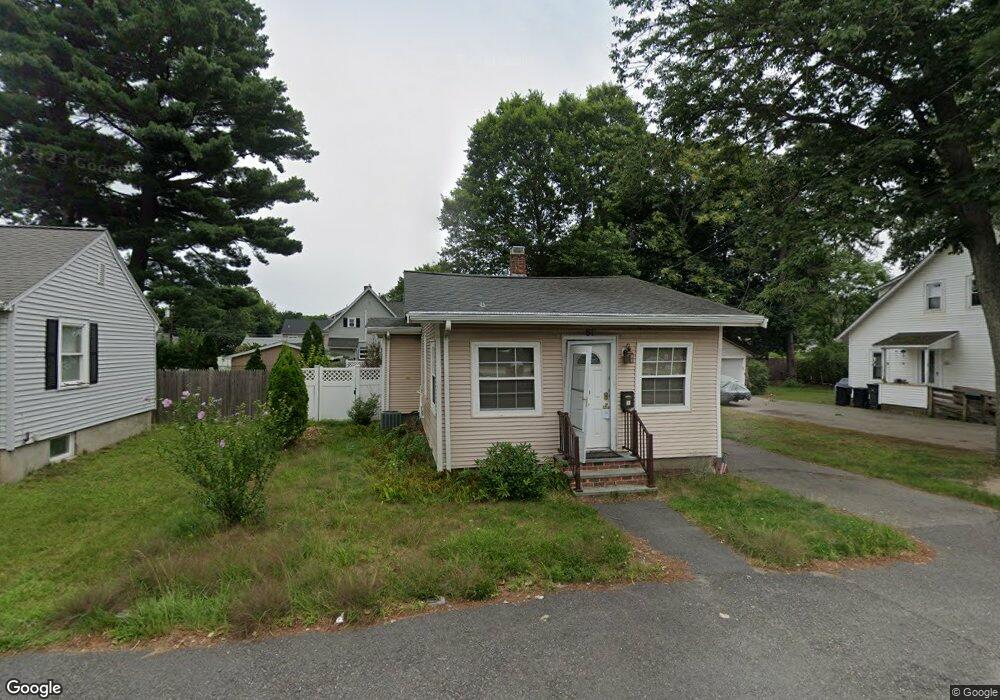
87 Oak St Unit 1 Natick, MA 01760
Estimated Value: $539,637 - $723,000
2
Beds
2
Baths
1,200
Sq Ft
$505/Sq Ft
Est. Value
About This Home
This home is located at 87 Oak St Unit 1, Natick, MA 01760 and is currently estimated at $606,159, approximately $505 per square foot. 87 Oak St Unit 1 is a home located in Middlesex County with nearby schools including Natick High School, Wilson Middle School, and Bennett-Hemenway (Ben-Hem) Elementary School.
Ownership History
Date
Name
Owned For
Owner Type
Purchase Details
Closed on
Oct 29, 2013
Sold by
Budhiraja Rt
Bought by
Schwartz Faina
Current Estimated Value
Purchase Details
Closed on
Mar 15, 2013
Sold by
Budhiraja Sudesh K
Bought by
Budhiraja Rt
Purchase Details
Closed on
Jun 25, 2007
Sold by
Chappelle John C
Bought by
Budhiraja Sudesh Kumar and Budhiraja Sundesh
Purchase Details
Closed on
Aug 21, 1996
Sold by
Chappelle Edward H
Bought by
Chappelle John C
Create a Home Valuation Report for This Property
The Home Valuation Report is an in-depth analysis detailing your home's value as well as a comparison with similar homes in the area
Home Values in the Area
Average Home Value in this Area
Purchase History
| Date | Buyer | Sale Price | Title Company |
|---|---|---|---|
| Schwartz Faina | $220,000 | -- | |
| Budhiraja Rt | -- | -- | |
| Budhiraja Sudesh Kumar | $242,000 | -- | |
| Chappelle John C | $95,000 | -- |
Source: Public Records
Mortgage History
| Date | Status | Borrower | Loan Amount |
|---|---|---|---|
| Previous Owner | Chappelle John C | $132,000 | |
| Previous Owner | Chappelle John C | $70,000 |
Source: Public Records
Tax History Compared to Growth
Tax History
| Year | Tax Paid | Tax Assessment Tax Assessment Total Assessment is a certain percentage of the fair market value that is determined by local assessors to be the total taxable value of land and additions on the property. | Land | Improvement |
|---|---|---|---|---|
| 2025 | $5,461 | $456,600 | $306,000 | $150,600 |
| 2024 | $5,338 | $435,400 | $294,500 | $140,900 |
| 2023 | $5,400 | $427,200 | $279,200 | $148,000 |
| 2022 | $5,203 | $390,000 | $256,200 | $133,800 |
| 2021 | $4,980 | $365,900 | $240,900 | $125,000 |
| 2020 | $4,825 | $354,500 | $229,500 | $125,000 |
| 2019 | $8,520 | $354,500 | $229,500 | $125,000 |
| 2018 | $4,218 | $323,200 | $229,500 | $93,700 |
| 2017 | $3,872 | $287,000 | $195,000 | $92,000 |
| 2016 | $3,496 | $257,600 | $166,400 | $91,200 |
| 2015 | $3,440 | $248,900 | $166,400 | $82,500 |
Source: Public Records
Map
Nearby Homes