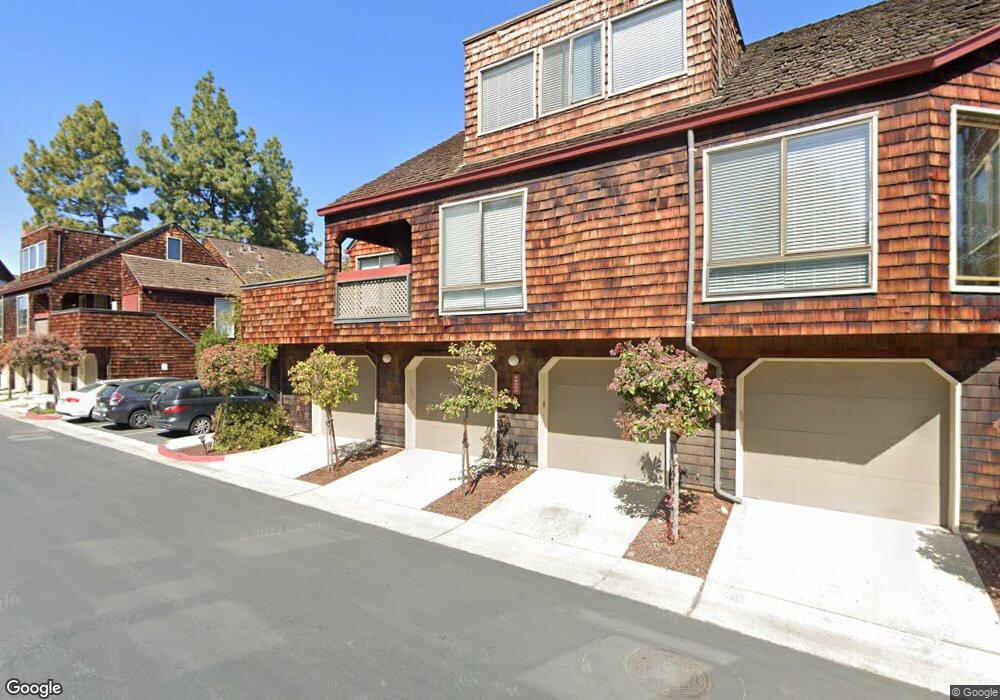
87 Peter Coutts Cir Stanford, CA 94305
Estimated Value: $1,005,000 - $1,176,000
2
Beds
2
Baths
1,609
Sq Ft
$671/Sq Ft
Est. Value
About This Home
This home is located at 87 Peter Coutts Cir, Stanford, CA 94305 and is currently estimated at $1,078,889, approximately $670 per square foot. 87 Peter Coutts Cir is a home located in Santa Clara County with nearby schools including Lucille M. Nixon Elementary School, Ellen Fletcher Middle, and Henry M. Gunn High School.
Ownership History
Date
Name
Owned For
Owner Type
Purchase Details
Closed on
Dec 21, 2021
Sold by
Rutt Brian K and Rooke Susan P
Bought by
Rutt Brian K and Rooke Susan P
Current Estimated Value
Home Financials for this Owner
Home Financials are based on the most recent Mortgage that was taken out on this home.
Original Mortgage
$270,200
Interest Rate
2.27%
Mortgage Type
New Conventional
Purchase Details
Closed on
Jun 4, 2007
Sold by
Miller Dale T
Bought by
Porter Carol A
Home Financials for this Owner
Home Financials are based on the most recent Mortgage that was taken out on this home.
Original Mortgage
$331,000
Interest Rate
6.16%
Mortgage Type
Stand Alone Second
Create a Home Valuation Report for This Property
The Home Valuation Report is an in-depth analysis detailing your home's value as well as a comparison with similar homes in the area
Home Values in the Area
Average Home Value in this Area
Purchase History
| Date | Buyer | Sale Price | Title Company |
|---|---|---|---|
| Rutt Brian K | -- | None Available | |
| Rutt Brian K | -- | Wfg National Title Ins Co | |
| Porter Carol A | -- | First American Title Company |
Source: Public Records
Mortgage History
| Date | Status | Borrower | Loan Amount |
|---|---|---|---|
| Closed | Rutt Brian K | $270,200 | |
| Closed | Porter Carol A | $331,000 | |
| Closed | Porter Carol A | $166,000 |
Source: Public Records
Tax History Compared to Growth
Tax History
| Year | Tax Paid | Tax Assessment Tax Assessment Total Assessment is a certain percentage of the fair market value that is determined by local assessors to be the total taxable value of land and additions on the property. | Land | Improvement |
|---|---|---|---|---|
| 2025 | $11,155 | $892,404 | $446,202 | $446,202 |
| 2024 | $11,155 | $874,906 | $437,453 | $437,453 |
| 2023 | $10,984 | $857,752 | $428,876 | $428,876 |
| 2022 | $10,933 | $840,934 | $420,467 | $420,467 |
| 2021 | $10,710 | $824,446 | $412,223 | $412,223 |
| 2020 | $10,417 | $815,994 | $407,997 | $407,997 |
| 2019 | $10,289 | $799,996 | $399,998 | $399,998 |
| 2018 | $10,016 | $784,310 | $392,155 | $392,155 |
| 2017 | $9,834 | $768,932 | $384,466 | $384,466 |
| 2016 | $9,563 | $753,856 | $376,928 | $376,928 |
| 2015 | $9,451 | $742,534 | $371,267 | $371,267 |
| 2014 | $9,185 | $727,990 | $363,995 | $363,995 |
Source: Public Records
Map
Nearby Homes
- 72 Peter Coutts Cir
- 103 Peter Coutts Cir
- 12 Peter Coutts Cir
- 843 Sonoma Terrace
- 715 Matadero Ave
- 546 Oxford Ave
- 410 Sheridan Ave Unit 227
- 410 Sheridan Ave Unit 446
- 5 Plan at Acacia
- 4X Plan at Acacia
- 4 Plan at Acacia
- 3 Plan at Acacia
- 2A Plan at Acacia
- 2 Plan at Acacia
- 1 Plan at Acacia
- 771 Barron Ave
- 772 Paul Ave
- 78 Pearce Mitchell Place
- 923 Shauna Ln
- 200 Sheridan Ave Unit 304
- 88 Peter Coutts Cir
- 94 Peter Coutts Cir
- 91 Peter Coutts Cir
- 89 Peter Coutts Cir Unit 89
- 96 Peter Coutts Cir
- 95 Peter Coutts Cir
- 93 Peter Coutts Cir
- 92 Peter Coutts Cir
- 90 Peter Coutts Cir
- 71 Peter Coutts Cir
- 2580 Amherst St
- 106 Peter Coutts Cir
- 104 Peter Coutts Cir
- 101 Peter Coutts Cir
- 100 Peter Coutts Cir
- 97 Peter Coutts Cir
- 82 Peter Coutts Cir
- 80 Peter Coutts Cir
- 78 Peter Coutts Cir
- 76 Peter Coutts Cir