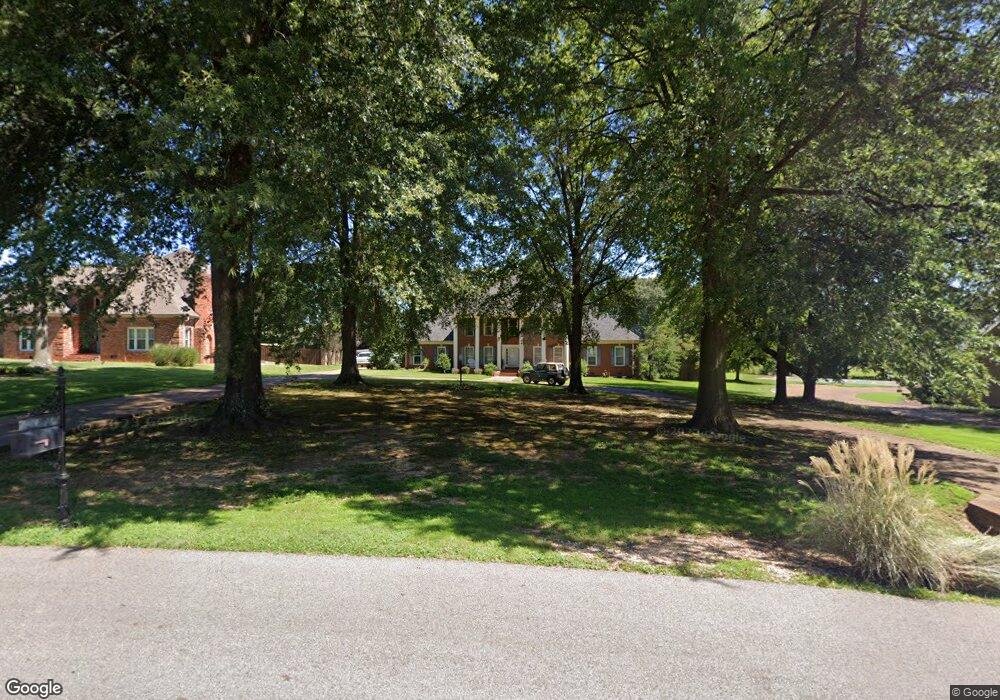
87 Redfield Dr Jackson, TN 38305
Estimated Value: $640,000 - $687,000
Studio
5
Baths
4,315
Sq Ft
$154/Sq Ft
Est. Value
About This Home
This home is located at 87 Redfield Dr, Jackson, TN 38305 and is currently estimated at $665,983, approximately $154 per square foot. 87 Redfield Dr is a home located in Madison County with nearby schools including Pope School, Northeast Middle School, and North Side High School.
Ownership History
Date
Name
Owned For
Owner Type
Purchase Details
Closed on
Feb 29, 2008
Sold by
Richard Andrews Peter
Bought by
Jesse Wheeler
Current Estimated Value
Purchase Details
Closed on
Jun 18, 2004
Sold by
Arnold William Ellis Iii E
Bought by
Richard Andrews Peter
Home Financials for this Owner
Home Financials are based on the most recent Mortgage that was taken out on this home.
Original Mortgage
$304,000
Interest Rate
6.25%
Purchase Details
Closed on
Dec 16, 2003
Sold by
Jackie Starnes
Bought by
Laxton Daniel K
Purchase Details
Closed on
May 31, 2000
Sold by
Bentley William A
Bought by
William Arnold
Purchase Details
Closed on
Nov 4, 1996
Sold by
King Ricky S
Bought by
William Bentley
Purchase Details
Closed on
Jul 29, 1991
Bought by
King Ricky S
Purchase Details
Closed on
Sep 6, 1988
Bought by
Blurton Jerry F
Purchase Details
Closed on
Jun 22, 1988
Bought by
Cherry Hill Pl Inc
Purchase Details
Closed on
Feb 19, 1987
Bought by
Johnson Ralph A and Lee Bradley
Create a Home Valuation Report for This Property
The Home Valuation Report is an in-depth analysis detailing your home's value as well as a comparison with similar homes in the area
Purchase History
| Date | Buyer | Sale Price | Title Company |
|---|---|---|---|
| Jesse Wheeler | $355,000 | -- | |
| Richard Andrews Peter | $380,000 | -- | |
| Laxton Daniel K | -- | -- | |
| William Arnold | $360,000 | -- | |
| William Bentley | $335,000 | -- | |
| King Ricky S | -- | -- | |
| Blurton Jerry F | -- | -- | |
| Cherry Hill Pl Inc | -- | -- | |
| Johnson Ralph A | -- | -- |
Source: Public Records
Mortgage History
| Date | Status | Borrower | Loan Amount |
|---|---|---|---|
| Previous Owner | Johnson Ralph A | $304,000 |
Source: Public Records
Tax History
| Year | Tax Paid | Tax Assessment Tax Assessment Total Assessment is a certain percentage of the fair market value that is determined by local assessors to be the total taxable value of land and additions on the property. | Land | Improvement |
|---|---|---|---|---|
| 2025 | $2,268 | $121,050 | $15,000 | $106,050 |
| 2024 | $2,268 | $121,050 | $15,000 | $106,050 |
| 2022 | $4,219 | $121,050 | $15,000 | $106,050 |
| 2021 | $3,572 | $82,850 | $6,825 | $76,025 |
| 2020 | $3,572 | $82,850 | $6,825 | $76,025 |
| 2019 | $3,572 | $82,850 | $6,825 | $76,025 |
| 2018 | $3,572 | $82,850 | $6,825 | $76,025 |
| 2017 | $3,491 | $79,125 | $6,825 | $72,300 |
| 2016 | $3,253 | $79,125 | $6,825 | $72,300 |
| 2015 | $3,254 | $79,125 | $6,825 | $72,300 |
| 2014 | $3,254 | $79,125 | $6,825 | $72,300 |
Source: Public Records
Map
Nearby Homes
- 119 Stonehenge Dr
- 465 Shadow Ridge Dr
- 60 Greendale Dr
- 42 Wilmington Cove
- 54 Laurelwood Cove
- 9 Citrus Springs Cove
- 100 Crest Ridge Dr
- 35 Hampstead Cove
- 49 Northwyke Dr
- 114 Larkwood Dr
- 64 Swanbourne Cove
- 58 Swanbourne Cove
- 107 Wyndchase Dr
- 127 Larkwood Dr
- 52 Buckingham Cove
- 159 Larkwood Dr
- 24 Stornaway Dr
- 51 Crownpointe Cove
- 116 Ravenwood Dr
- 32 Hollinsworth Cove
- 81 Redfield Dr
- 95 Redfield Dr
- 20 Stonehenge Dr
- 32 Stonehenge Dr
- 8 Stonehenge Dr
- 105 Redfield Dr
- 88 Redfield Dr
- 69 Redfield Dr
- 46 Stonehenge Dr
- 29 Elmhurst Dr
- 39 Elmhurst Dr
- 115 Redfield Dr
- 59 Redfield Dr
- 58 Stonehenge Dr
- 108 Redfield Dr
- 70 Redfield Dr
- 11 Stonehenge Dr
- 35 Stonehenge Dr
- 49 Elmhurst Dr
- 70 Stonehenge Dr
Your Personal Tour Guide
Ask me questions while you tour the home.