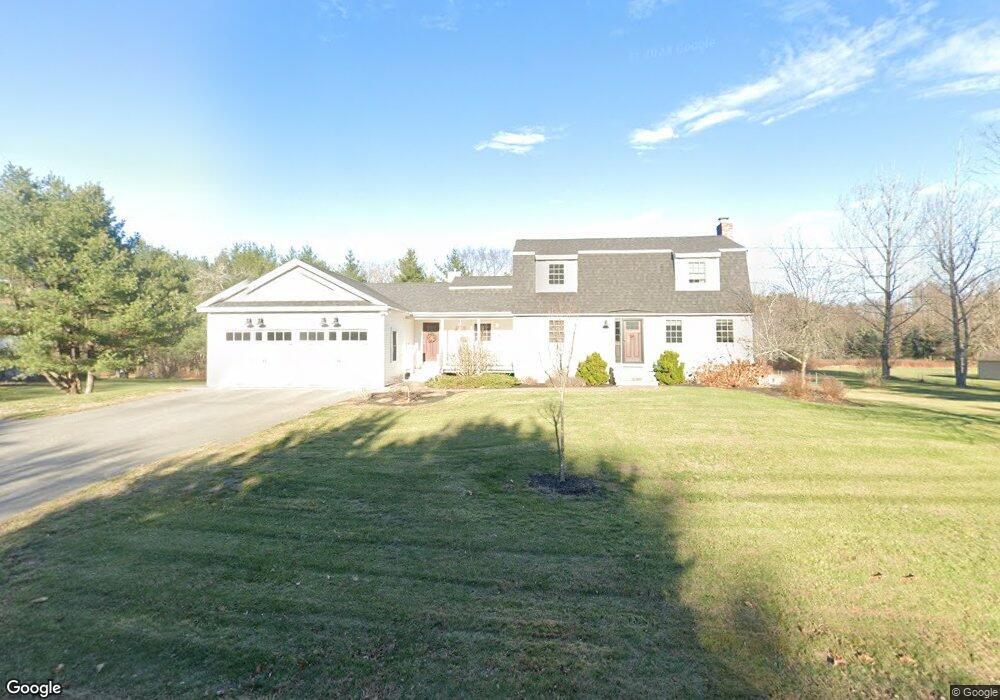
87 South Rd North Hampton, NH 03862
Estimated Value: $794,000 - $857,000
3
Beds
3
Baths
2,105
Sq Ft
$392/Sq Ft
Est. Value
About This Home
This home is located at 87 South Rd, North Hampton, NH 03862 and is currently estimated at $825,025, approximately $391 per square foot. 87 South Rd is a home with nearby schools including North Hampton School, Winnacunnet High School, and Appleseeds Day School.
Ownership History
Date
Name
Owned For
Owner Type
Purchase Details
Closed on
Nov 29, 2023
Sold by
Thomas J Scanlon T J and Thomas Scanlon
Bought by
Ponchak Michael and Ponchak Bailey
Current Estimated Value
Home Financials for this Owner
Home Financials are based on the most recent Mortgage that was taken out on this home.
Original Mortgage
$620,000
Outstanding Balance
$608,935
Interest Rate
7.63%
Mortgage Type
Purchase Money Mortgage
Estimated Equity
$216,090
Purchase Details
Closed on
Jul 25, 2019
Sold by
Scanlon Thomas J and Scanlon Karen M
Bought by
Thomas J Scanlon T
Purchase Details
Closed on
Oct 29, 2013
Sold by
Bennett Ft and Bennett
Bought by
Scanlon Thomas J and Scanlon Karen M
Create a Home Valuation Report for This Property
The Home Valuation Report is an in-depth analysis detailing your home's value as well as a comparison with similar homes in the area
Home Values in the Area
Average Home Value in this Area
Purchase History
| Date | Buyer | Sale Price | Title Company |
|---|---|---|---|
| Ponchak Michael | $775,000 | None Available | |
| Ponchak Michael | $775,000 | None Available | |
| Thomas J Scanlon T | -- | -- | |
| Scanlon Thomas J | $240,000 | -- | |
| Scanlon Thomas J | $240,000 | -- |
Source: Public Records
Mortgage History
| Date | Status | Borrower | Loan Amount |
|---|---|---|---|
| Open | Ponchak Michael | $620,000 | |
| Closed | Ponchak Michael | $620,000 | |
| Closed | Scanlon Thomas J | $0 |
Source: Public Records
Tax History
| Year | Tax Paid | Tax Assessment Tax Assessment Total Assessment is a certain percentage of the fair market value that is determined by local assessors to be the total taxable value of land and additions on the property. | Land | Improvement |
|---|---|---|---|---|
| 2024 | $7,272 | $568,100 | $227,600 | $340,500 |
| 2023 | $7,073 | $568,100 | $227,600 | $340,500 |
| 2022 | $7,459 | $434,400 | $190,600 | $243,800 |
| 2021 | $7,198 | $434,400 | $190,600 | $243,800 |
| 2020 | $7,346 | $434,400 | $190,600 | $243,800 |
| 2019 | $7,270 | $435,300 | $190,600 | $244,700 |
| 2018 | $7,069 | $435,300 | $190,600 | $244,700 |
| 2017 | $6,488 | $350,700 | $159,600 | $191,100 |
| 2016 | $6,024 | $338,600 | $159,600 | $179,000 |
| 2015 | $5,466 | $312,700 | $159,600 | $153,100 |
| 2014 | $4,968 | $291,400 | $159,600 | $131,800 |
| 2013 | $5,048 | $301,400 | $159,600 | $141,800 |
Source: Public Records
Map
Nearby Homes
Your Personal Tour Guide
Ask me questions while you tour the home.