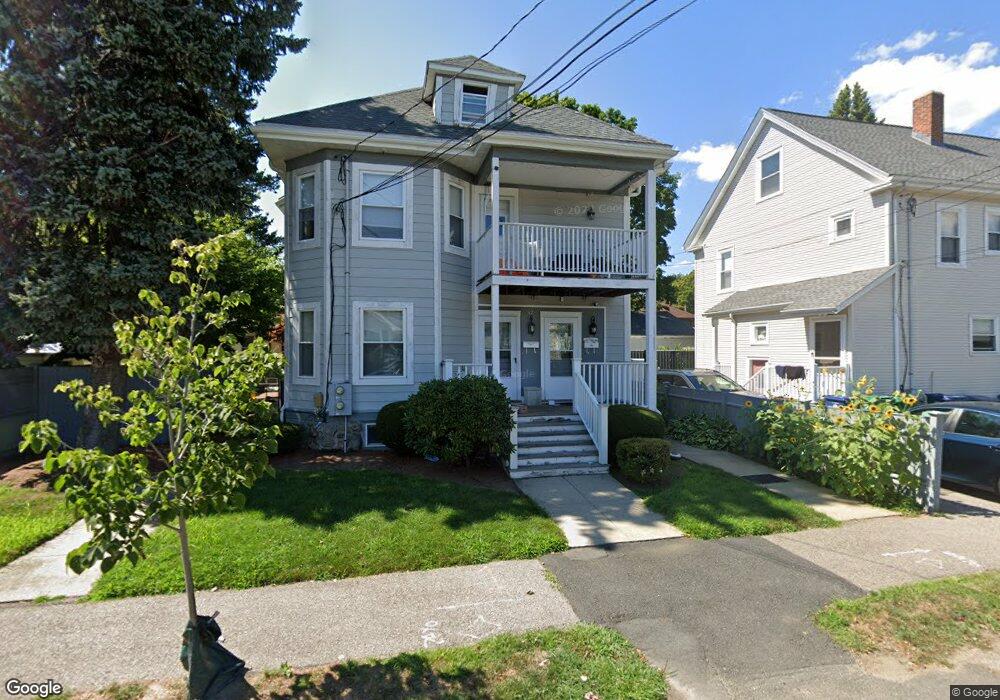
87 Tolman St Unit 85,85-87 West Newton, MA 02465
West Newton NeighborhoodEstimated Value: $807,898 - $911,000
2
Beds
2
Baths
2,600
Sq Ft
$326/Sq Ft
Est. Value
About This Home
This home is located at 87 Tolman St Unit 85,85-87, West Newton, MA 02465 and is currently estimated at $847,725, approximately $326 per square foot. 87 Tolman St Unit 85,85-87 is a home located in Middlesex County with nearby schools including Franklin Elementary School, F.A. Day Middle School, and Newton North High School.
Ownership History
Date
Name
Owned For
Owner Type
Purchase Details
Closed on
Sep 15, 2023
Sold by
Lee Min and Lin Jianguang
Bought by
Lin Yifen and Liang Huixin
Current Estimated Value
Home Financials for this Owner
Home Financials are based on the most recent Mortgage that was taken out on this home.
Original Mortgage
$592,000
Outstanding Balance
$578,163
Interest Rate
6.9%
Mortgage Type
Purchase Money Mortgage
Estimated Equity
$269,562
Purchase Details
Closed on
Oct 28, 2016
Sold by
Lawless Jami L
Bought by
Lee Min and Lin Jianguang
Home Financials for this Owner
Home Financials are based on the most recent Mortgage that was taken out on this home.
Original Mortgage
$260,000
Interest Rate
3.5%
Mortgage Type
New Conventional
Purchase Details
Closed on
May 20, 2005
Sold by
Columba Michael
Bought by
Kurzon Andrew W
Home Financials for this Owner
Home Financials are based on the most recent Mortgage that was taken out on this home.
Original Mortgage
$438,400
Interest Rate
5.95%
Mortgage Type
Purchase Money Mortgage
Purchase Details
Closed on
Feb 28, 2005
Sold by
Colomba Michael
Bought by
Lawless Jami Lee
Purchase Details
Closed on
Apr 5, 2004
Sold by
Colomba Cettina M
Bought by
Colomba Michael
Create a Home Valuation Report for This Property
The Home Valuation Report is an in-depth analysis detailing your home's value as well as a comparison with similar homes in the area
Home Values in the Area
Average Home Value in this Area
Purchase History
| Date | Buyer | Sale Price | Title Company |
|---|---|---|---|
| Lin Yifen | $740,000 | None Available | |
| Lee Min | $559,000 | -- | |
| Kurzon Andrew W | $548,000 | -- | |
| Kurzon Andrew W | $548,000 | -- | |
| Kurzon Andrew W | $548,000 | -- | |
| Lawless Jami Lee | $395,000 | -- | |
| Lawless Jami Lee | $395,000 | -- | |
| Lawless Jami Lee | $395,000 | -- | |
| Colomba Michael | -- | -- | |
| Colomba Michael | -- | -- | |
| Colomba Michael | -- | -- |
Source: Public Records
Mortgage History
| Date | Status | Borrower | Loan Amount |
|---|---|---|---|
| Open | Lin Yifen | $592,000 | |
| Closed | Lin Yifen | $592,000 | |
| Previous Owner | Lee Min | $260,000 | |
| Previous Owner | Kurzon Andrew W | $438,400 |
Source: Public Records
Tax History Compared to Growth
Tax History
| Year | Tax Paid | Tax Assessment Tax Assessment Total Assessment is a certain percentage of the fair market value that is determined by local assessors to be the total taxable value of land and additions on the property. | Land | Improvement |
|---|---|---|---|---|
| 2025 | $6,924 | $706,500 | $0 | $706,500 |
| 2024 | $6,694 | $685,900 | $0 | $685,900 |
| 2023 | $6,443 | $632,900 | $0 | $632,900 |
| 2022 | $6,341 | $602,800 | $0 | $602,800 |
| 2021 | $5,856 | $568,700 | $0 | $568,700 |
| 2020 | $5,317 | $568,700 | $0 | $568,700 |
| 2019 | $5,661 | $541,700 | $0 | $541,700 |
| 2018 | $4,986 | $459,600 | $0 | $459,600 |
| 2017 | $4,822 | $433,600 | $0 | $433,600 |
| 2016 | $4,611 | $405,200 | $0 | $405,200 |
| 2015 | $4,480 | $385,900 | $0 | $385,900 |
Source: Public Records
Map
Nearby Homes
- 24 Tolman St Unit A
- 31-37 Washington Ave
- 11 Derby St
- 265-267 River St Unit 267
- 265-267 River St Unit 265
- 138 Myrtle St Unit 2
- 73 Orange St Unit 2
- 162 Myrtle St Unit 1
- 81 Alder St
- 47 Alder St Unit 6
- 40 Myrtle St Unit 9
- 56 Dearborn St
- 75 Cherry St
- 312 Newton St Unit 1A
- 42 Alder St
- 15 Alder St Unit 1
- 101-103 Lexington St
- 44 Westland Ave
- 308 Newton St Unit 1
- 39 Clinton St Unit 2
- 87 Tolman St
- 87 Tolman St Unit 87
- 87 Tolman St Unit 2
- 85 Tolman St Unit 2
- 85 Tolman St
- 85 Tolman St Unit 85,85-87
- 85 Tolman St Unit 2F
- 85 Tolman St Unit 85
- 33 Laurel Ave Unit 35
- 279 Derby St
- 279 Derby St Unit 1
- 285 Derby St
- 25 Laurel Ave
- 291 Derby St
- 86 Tolman St
- 92 Tolman St
- 84 Tolman St
- 21 Laurel Ave
- 80 Tolman St
- 71 Tolman St