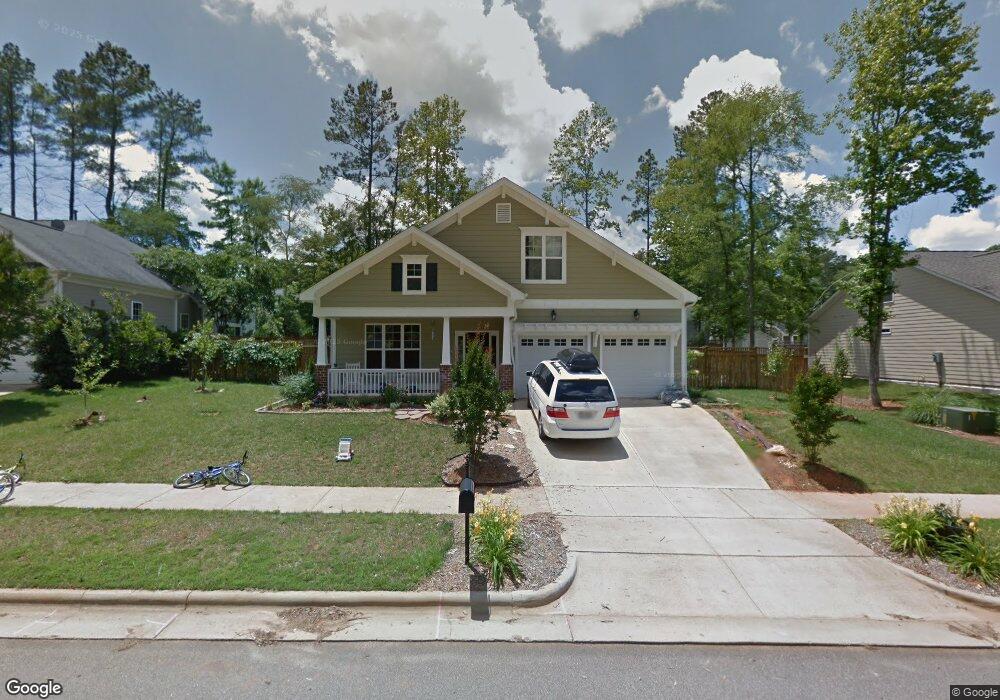
87 Wickham Dr Pittsboro, NC 27312
Estimated Value: $547,000 - $648,000
4
Beds
3
Baths
3,174
Sq Ft
$191/Sq Ft
Est. Value
About This Home
This home is located at 87 Wickham Dr, Pittsboro, NC 27312 and is currently estimated at $605,858, approximately $190 per square foot. 87 Wickham Dr is a home located in Chatham County with nearby schools including Pittsboro Elementary School, George Moses Horton Middle School, and Northwood High.
Ownership History
Date
Name
Owned For
Owner Type
Purchase Details
Closed on
Jun 15, 2016
Sold by
Fann Michael J and Fann Rachel B
Bought by
Baragona Jo Powers and Baragona Paul J
Current Estimated Value
Purchase Details
Closed on
Jan 7, 2013
Sold by
Piccola Builders Inc
Bought by
Fann Michael J and Fann Rachel B
Home Financials for this Owner
Home Financials are based on the most recent Mortgage that was taken out on this home.
Original Mortgage
$265,000
Interest Rate
4.25%
Mortgage Type
New Conventional
Purchase Details
Closed on
Jun 11, 2012
Sold by
Powell Place Development Company
Bought by
Piccola Builders Inc
Home Financials for this Owner
Home Financials are based on the most recent Mortgage that was taken out on this home.
Original Mortgage
$180,000
Interest Rate
3.83%
Mortgage Type
Future Advance Clause Open End Mortgage
Create a Home Valuation Report for This Property
The Home Valuation Report is an in-depth analysis detailing your home's value as well as a comparison with similar homes in the area
Home Values in the Area
Average Home Value in this Area
Purchase History
| Date | Buyer | Sale Price | Title Company |
|---|---|---|---|
| Baragona Jo Powers | $290,000 | Attorney | |
| Fann Michael J | $265,000 | None Available | |
| Piccola Builders Inc | $32,500 | None Available |
Source: Public Records
Mortgage History
| Date | Status | Borrower | Loan Amount |
|---|---|---|---|
| Previous Owner | Fann Michael J | $265,000 | |
| Previous Owner | Piccola Builders Inc | $180,000 |
Source: Public Records
Tax History Compared to Growth
Tax History
| Year | Tax Paid | Tax Assessment Tax Assessment Total Assessment is a certain percentage of the fair market value that is determined by local assessors to be the total taxable value of land and additions on the property. | Land | Improvement |
|---|---|---|---|---|
| 2025 | $1,768 | $612,771 | $72,450 | $540,321 |
| 2024 | $1,768 | $408,304 | $63,000 | $345,304 |
| 2023 | $1,392 | $408,304 | $63,000 | $345,304 |
| 2022 | $1,215 | $408,304 | $63,000 | $345,304 |
| 2021 | $1,168 | $408,304 | $63,000 | $345,304 |
| 2020 | $897 | $304,653 | $50,000 | $254,653 |
| 2019 | $3,546 | $304,653 | $50,000 | $254,653 |
| 2018 | $764 | $304,653 | $50,000 | $254,653 |
| 2017 | $3,399 | $304,653 | $50,000 | $254,653 |
| 2016 | $3,388 | $302,054 | $50,000 | $252,054 |
| 2015 | $3,352 | $302,054 | $50,000 | $252,054 |
| 2014 | $3,352 | $302,054 | $50,000 | $252,054 |
| 2013 | -- | $250,935 | $50,000 | $200,935 |
Source: Public Records
Map
Nearby Homes
- 73 Freeman Dr
- 26 Danbury Ct
- 115 Circle City Way
- CHANLEY Plan at Corbett Landing
- CHAMPLAIN Plan at Corbett Landing
- ELMSDALE Plan at Corbett Landing
- SEBASTIAN Plan at Corbett Landing
- DRESDEN Plan at Corbett Landing
- BALLENTINE Plan at Corbett Landing
- PARKETTE Plan at Corbett Landing
- MARABELLE Plan at Corbett Landing
- KENDALL Plan at Corbett Landing
- THEODORE Plan at Corbett Landing
- BRANFORD Plan at Corbett Landing
- KAITLYN Plan at Corbett Landing
- 289 Gaines Trail
- 63 Loggers
- Shelby Modern Farmhouse Plan at Corbett Landing
- Chatham Forest English Cottage Plan at Corbett Landing
- Hamilton Craftsman Plan at Corbett Landing
- 67 Wickham Dr
- 105 N Wickham Dr
- 61 Wickham Dr
- 86 Freeman Dr
- 100 N Freeman Dr
- 86 N Freeman Dr
- 72 Freeman Dr
- 59 Wickham Dr
- 72 N Freeman Dr
- 58 Wickham Dr
- 74 Wickham Dr
- 58 Freeman Dr
- 58 N Freeman Dr
- 45 Wickham Dr
- 189 Cobble Ridge Dr
- 143 Cobble Ridge Dr
- 46 Freeman Dr
- 46 N Freeman Dr
- 46 Wickham Dr
- 33 Wickham Dr