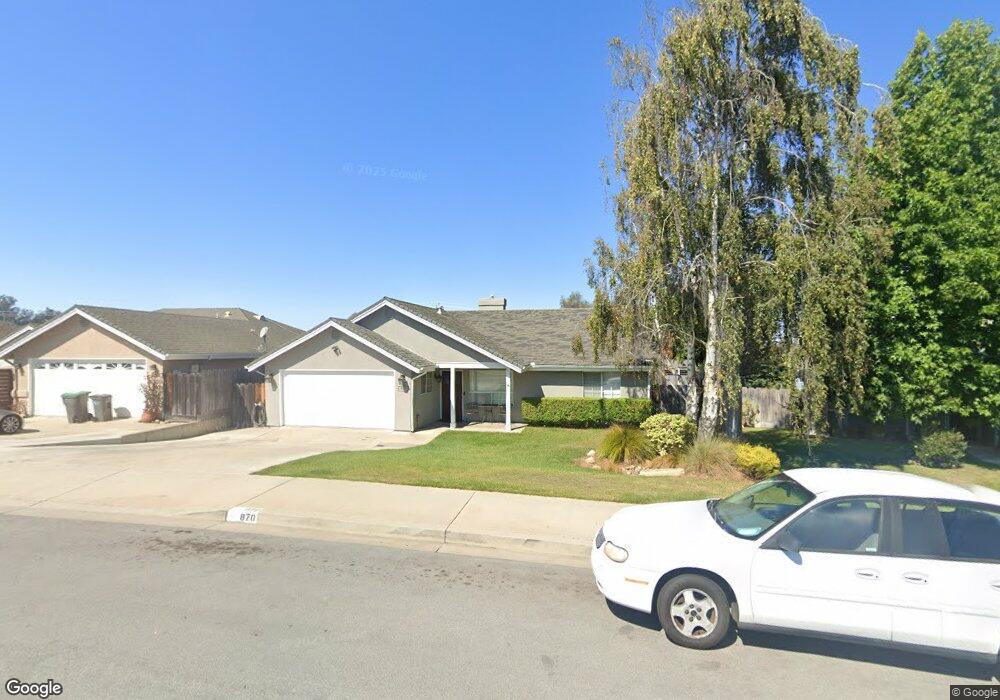
870 Alina Ln Nipomo, CA 93444
Estimated Value: $677,000 - $723,000
3
Beds
2
Baths
1,291
Sq Ft
$548/Sq Ft
Est. Value
About This Home
This home is located at 870 Alina Ln, Nipomo, CA 93444 and is currently estimated at $707,684, approximately $548 per square foot. 870 Alina Ln is a home located in San Luis Obispo County with nearby schools including Dana Elementary School, Mesa Middle School, and Nipomo High School.
Ownership History
Date
Name
Owned For
Owner Type
Purchase Details
Closed on
Dec 14, 2009
Sold by
Mcgregor Elizabeth P
Bought by
Benzon Joshua
Current Estimated Value
Home Financials for this Owner
Home Financials are based on the most recent Mortgage that was taken out on this home.
Original Mortgage
$300,457
Outstanding Balance
$196,076
Interest Rate
4.91%
Mortgage Type
FHA
Estimated Equity
$511,608
Purchase Details
Closed on
Aug 23, 2004
Sold by
Reed Richard and Reed Marcia Ann
Bought by
Mcgregor Elizabeth P
Home Financials for this Owner
Home Financials are based on the most recent Mortgage that was taken out on this home.
Original Mortgage
$179,000
Interest Rate
1%
Mortgage Type
New Conventional
Purchase Details
Closed on
Jan 4, 2001
Sold by
Morrison Lawanda S
Bought by
Reed Marcia Ann
Purchase Details
Closed on
Sep 12, 1997
Sold by
Mesa Dunes Investments Inc
Bought by
Morrison Lawanda S
Home Financials for this Owner
Home Financials are based on the most recent Mortgage that was taken out on this home.
Original Mortgage
$131,135
Interest Rate
7.13%
Create a Home Valuation Report for This Property
The Home Valuation Report is an in-depth analysis detailing your home's value as well as a comparison with similar homes in the area
Home Values in the Area
Average Home Value in this Area
Purchase History
| Date | Buyer | Sale Price | Title Company |
|---|---|---|---|
| Benzon Joshua | $306,000 | Fidelity National Title Co | |
| Mcgregor Elizabeth P | $439,000 | Fidelity Title Company | |
| Reed Marcia Ann | $219,000 | Cuesta Title Company | |
| Morrison Lawanda S | $135,000 | Chicago Title Co |
Source: Public Records
Mortgage History
| Date | Status | Borrower | Loan Amount |
|---|---|---|---|
| Open | Benzon Joshua | $300,457 | |
| Previous Owner | Mcgregor Elizabeth P | $179,000 | |
| Previous Owner | Morrison Lawanda S | $131,135 |
Source: Public Records
Tax History Compared to Growth
Tax History
| Year | Tax Paid | Tax Assessment Tax Assessment Total Assessment is a certain percentage of the fair market value that is determined by local assessors to be the total taxable value of land and additions on the property. | Land | Improvement |
|---|---|---|---|---|
| 2025 | $4,081 | $394,979 | $193,616 | $201,363 |
| 2024 | $4,034 | $387,235 | $189,820 | $197,415 |
| 2023 | $4,034 | $379,644 | $186,099 | $193,545 |
| 2022 | $3,974 | $372,200 | $182,450 | $189,750 |
| 2021 | $3,966 | $364,903 | $178,873 | $186,030 |
| 2020 | $3,921 | $361,162 | $177,039 | $184,123 |
| 2019 | $3,897 | $354,081 | $173,568 | $180,513 |
| 2018 | $3,851 | $347,139 | $170,165 | $176,974 |
| 2017 | $3,779 | $340,333 | $166,829 | $173,504 |
| 2016 | $3,565 | $333,660 | $163,558 | $170,102 |
| 2015 | $3,515 | $328,649 | $161,102 | $167,547 |
| 2014 | $3,385 | $322,212 | $157,947 | $164,265 |
Source: Public Records
Map
Nearby Homes
- 759 Viola Ct
- 719 W Tefft St
- 219 Lema Dr
- 217 Hope Way
- 680 Hill St
- 231 Trevino Dr
- 875 Camino Caballo
- Mesa Plan at Hill Street Terraces - Hill Street Series
- Pacific Plan at Hill Street Terraces - Hill Street Series
- Monarch Plan at Hill Street Terraces - Hill Street Series
- Rancho Plan at Hill Street Terraces - Hill Street Series
- Dana Plan at Hill Street Terraces - Hill Street Series
- 228 Chaparral Ln
- 232 Scarlett Cir
- 261 Hazel Ln
- 255 Encino Ln
- 483 Violet Ave
- 426 Polaris Dr
- 457 Polaris Dr
- 615 Sweet Donna Place
- 872 Alina Ln
- 868 Alina Ln
- 0 La Cumbre Ln
- 0 La Cumbre Ln Unit 997771
- 0 La Cumbre Ln Unit 12 952043
- 0 La Cumbre Ln Unit 141354
- 0 La Cumbre Ln Unit LOT 851104
- 874 Alina Ln
- 866 Alina Ln
- 869 Alina Ln
- 873 Alina Ln
- 876 Alina Ln
- 867 Alina Ln
- 875 Alina Ln
- 865 Alina Ln
- 878 Alina Ln
- 868 Bernita Place
- 877 Alina Ln
- 877 Alina Ln
- 866 Bernita Place