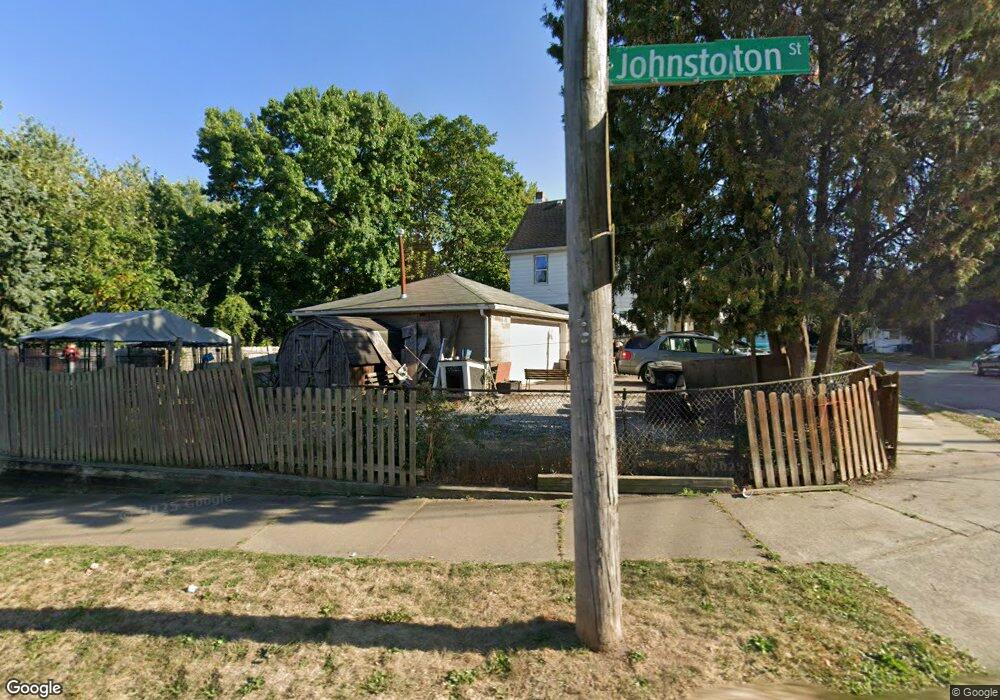
870 Johnston St Akron, OH 44306
Middlebury NeighborhoodEstimated Value: $75,649 - $96,000
3
Beds
1
Bath
1,882
Sq Ft
$46/Sq Ft
Est. Value
About This Home
This home is located at 870 Johnston St, Akron, OH 44306 and is currently estimated at $85,825, approximately $45 per square foot. 870 Johnston St is a home located in Summit County with nearby schools including Case Preparatory Academy, Middlebury Academy, and Arlington Christian Academy.
Ownership History
Date
Name
Owned For
Owner Type
Purchase Details
Closed on
Nov 15, 2004
Sold by
Fleet National Bank
Bought by
Thompson Angela Marie
Current Estimated Value
Purchase Details
Closed on
Nov 24, 2003
Sold by
Wood Richard T
Bought by
Fleet National Bank
Purchase Details
Closed on
Apr 15, 2000
Sold by
Daniele Joseph
Bought by
Wood Richard T and Wood Debbie A
Home Financials for this Owner
Home Financials are based on the most recent Mortgage that was taken out on this home.
Original Mortgage
$53,000
Interest Rate
8.22%
Mortgage Type
Purchase Money Mortgage
Purchase Details
Closed on
Sep 2, 1998
Sold by
Allebach Frances P
Bought by
Tucker Land Management Llc
Purchase Details
Closed on
Jan 5, 1988
Sold by
Tucker Land Management Llc
Bought by
Daniele Joseph
Home Financials for this Owner
Home Financials are based on the most recent Mortgage that was taken out on this home.
Original Mortgage
$29,750
Interest Rate
6.79%
Mortgage Type
Purchase Money Mortgage
Create a Home Valuation Report for This Property
The Home Valuation Report is an in-depth analysis detailing your home's value as well as a comparison with similar homes in the area
Home Values in the Area
Average Home Value in this Area
Purchase History
| Date | Buyer | Sale Price | Title Company |
|---|---|---|---|
| Thompson Angela Marie | $13,500 | Sovereign Title Agency Llc | |
| Fleet National Bank | $49,000 | Fidelity National Title Insu | |
| Wood Richard T | $53,000 | -- | |
| Tucker Land Management Llc | $15,000 | -- | |
| Daniele Joseph | $35,000 | Midland Commerce Group |
Source: Public Records
Mortgage History
| Date | Status | Borrower | Loan Amount |
|---|---|---|---|
| Previous Owner | Wood Richard T | $53,000 | |
| Previous Owner | Daniele Joseph | $29,750 |
Source: Public Records
Tax History Compared to Growth
Tax History
| Year | Tax Paid | Tax Assessment Tax Assessment Total Assessment is a certain percentage of the fair market value that is determined by local assessors to be the total taxable value of land and additions on the property. | Land | Improvement |
|---|---|---|---|---|
| 2025 | $50,058 | $2,107 | $2,107 | -- |
| 2024 | $503 | $2,107 | $2,107 | -- |
| 2023 | $278 | $2,107 | $2,107 | -- |
| 2022 | $278 | $2,107 | $2,107 | $0 |
| 2021 | $278 | $2,107 | $2,107 | $0 |
| 2020 | $795 | $2,110 | $2,110 | $0 |
| 2019 | $928 | $3,270 | $3,270 | $0 |
| 2018 | $563 | $3,270 | $3,270 | $0 |
| 2017 | $1,061 | $3,270 | $3,270 | $0 |
| 2016 | $1,061 | $3,270 | $3,270 | $0 |
| 2015 | $1,061 | $3,270 | $3,270 | $0 |
| 2014 | $2,288 | $3,270 | $3,270 | $0 |
| 2013 | $1,583 | $3,270 | $3,270 | $0 |
Source: Public Records
Map
Nearby Homes
- 429 Mcgowan St
- 442 Matthews St
- 327 Black St
- 828 Crouse St
- 1048 Ackley St
- 1071 Fairbanks Place
- 836 5th Ave
- 0 S Arlington St Unit 5134164
- 498 Gage St
- 495 Beacon St
- 495 Elbon Ave
- 397 Spicer St
- 393 Spicer St
- 403 Spicer St
- 166 Chittenden St
- 696 Inman St
- 279 Miles Ave
- 695 Carroll St
- 634 Spicer St
- 693 Carroll St
- 876 Johnston St
- 415 Mcgowan St
- 413 Mcgowan St
- 413 Mcgowan St
- 880 Johnston St
- 421 Mcgowan St
- 418 Downing Place
- 425 Mcgowan St
- 422 Downing Place
- 850 Johnston St
- 884 Johnston St
- 426 Downing Place
- 873 Johnston St
- 427 Mcgowan St
- 428 Downing Place
- 414 Mcgowan St
- 875 Johnston St
- 879 Johnston St
- 432 Downing Place
- 844 Johnston St