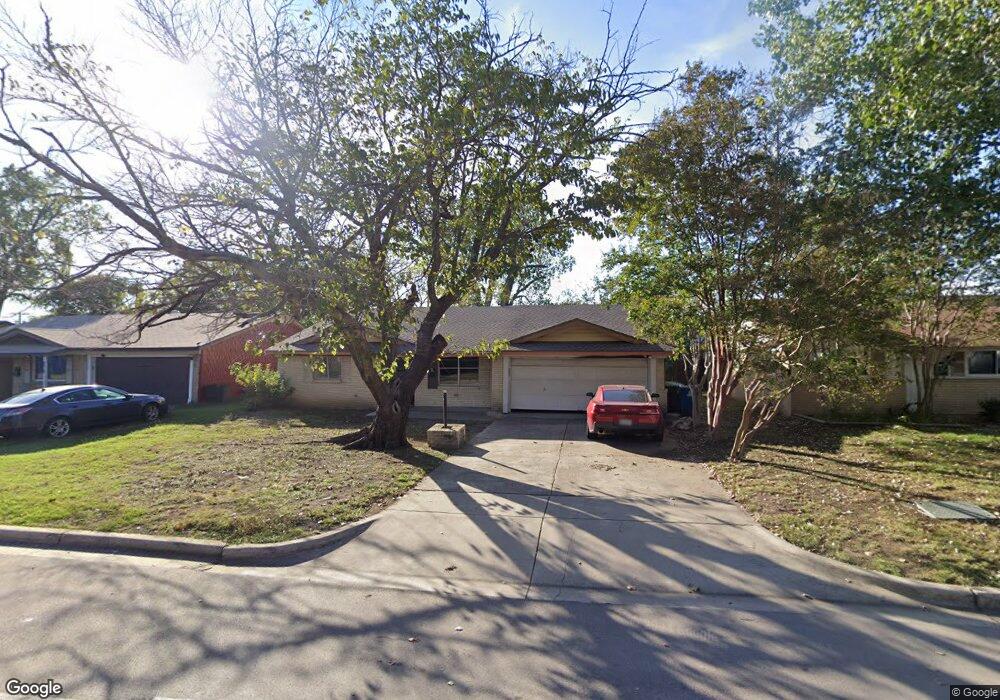
870 Lovers Ln Grapevine, TX 76051
Estimated Value: $332,231 - $360,000
3
Beds
2
Baths
1,357
Sq Ft
$255/Sq Ft
Est. Value
About This Home
This home is located at 870 Lovers Ln, Grapevine, TX 76051 and is currently estimated at $345,558, approximately $254 per square foot. 870 Lovers Ln is a home located in Tarrant County with nearby schools including Cannon Elementary School, Grapevine Middle, and Grapevine Faith Christian School.
Ownership History
Date
Name
Owned For
Owner Type
Purchase Details
Closed on
Aug 2, 2023
Sold by
Ivy Lakes Investments Ii Llc
Bought by
Carranza Julio
Current Estimated Value
Home Financials for this Owner
Home Financials are based on the most recent Mortgage that was taken out on this home.
Original Mortgage
$300,948
Outstanding Balance
$293,910
Interest Rate
6.67%
Mortgage Type
FHA
Estimated Equity
$51,648
Purchase Details
Closed on
Oct 2, 2020
Sold by
Serrano Development Company Llc
Bought by
Ivy Lake Investments Ii Llc
Purchase Details
Closed on
Sep 8, 2020
Sold by
Adamson Barbara and Shepherd George
Bought by
Serrano Development Company Llc
Purchase Details
Closed on
Dec 29, 2010
Sold by
Adamson Barbara
Bought by
Adamson Barbara and Shepherd George H
Purchase Details
Closed on
Oct 23, 2004
Sold by
Mayes Mitchell and Alexander Anna
Bought by
Adamson Barbara
Create a Home Valuation Report for This Property
The Home Valuation Report is an in-depth analysis detailing your home's value as well as a comparison with similar homes in the area
Home Values in the Area
Average Home Value in this Area
Purchase History
| Date | Buyer | Sale Price | Title Company |
|---|---|---|---|
| Carranza Julio | -- | Old Republic National Title In | |
| Ivy Lake Investments Ii Llc | -- | None Listed On Document | |
| Serrano Development Company Llc | -- | None Available | |
| Adamson Barbara | -- | None Available | |
| Adamson Barbara | -- | None Available | |
| Adamson Barbara | -- | Fidelity National Title |
Source: Public Records
Mortgage History
| Date | Status | Borrower | Loan Amount |
|---|---|---|---|
| Open | Carranza Julio | $300,948 | |
| Closed | Carranza Julio | $9,028 |
Source: Public Records
Tax History Compared to Growth
Tax History
| Year | Tax Paid | Tax Assessment Tax Assessment Total Assessment is a certain percentage of the fair market value that is determined by local assessors to be the total taxable value of land and additions on the property. | Land | Improvement |
|---|---|---|---|---|
| 2025 | $1,161 | $240,763 | $65,000 | $175,763 |
| 2024 | $1,161 | $240,763 | $65,000 | $175,763 |
| 2023 | $3,946 | $235,361 | $55,000 | $180,361 |
| 2022 | $3,308 | $166,977 | $30,000 | $136,977 |
| 2021 | $4,110 | $189,015 | $30,000 | $159,015 |
| 2020 | $4,223 | $192,000 | $30,000 | $162,000 |
| 2019 | $4,584 | $201,000 | $30,000 | $171,000 |
| 2018 | $838 | $141,000 | $30,000 | $111,000 |
| 2017 | $3,640 | $157,380 | $30,000 | $127,380 |
| 2016 | $3,000 | $129,741 | $30,000 | $99,741 |
| 2015 | $2,450 | $106,800 | $15,000 | $91,800 |
| 2014 | $2,450 | $106,800 | $15,000 | $91,800 |
Source: Public Records
Map
Nearby Homes
- 1028 Texan Trail
- 2971 Kosse Ct
- 826 E Texas St
- 717 E Worth St
- 223 Wood St Unit 201
- 723 E Worth St
- 424 E Worth St Unit 422-24
- 210 Austin St
- 525 Estill St
- 509 Estill St
- 250 E Dallas Rd Unit 128
- 250 E Dallas Rd Unit 119
- 250 E Dallas Rd Unit 124
- 250 E Dallas Rd Unit 113
- 218 E Dallas Rd Unit 102
- 422 Smith St
- 404 E Wall St
- 404 W Hudgins St
- 1120 S Pine St
- 1338 Airline Dr
- 864 Lovers Ln
- 874 Lovers Ln
- 867 Twilight Trail
- 860 Lovers Ln
- 861 Twilight Trail
- 871 Twilight Trail
- 878 Lovers Ln
- 871 Lovers Ln
- 857 Twilight Trail
- 875 Lovers Ln
- 877 Twilight Trail
- 865 Lovers Ln
- 854 Lovers Ln
- 879 Lovers Ln
- 861 Lovers Ln
- 851 Twilight Trail
- 850 Lovers Ln
- 855 Lovers Ln
- 868 Twilight Trail
- 1090 Easy St