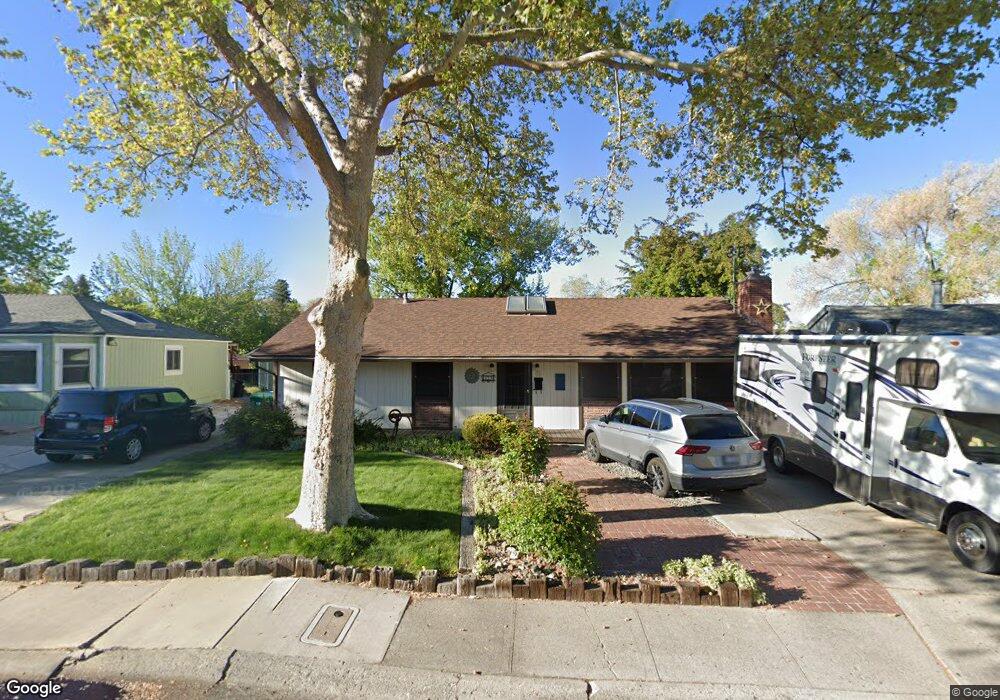
870 Ruby Ave Reno, NV 89503
Kings Row NeighborhoodEstimated Value: $489,000 - $503,000
4
Beds
2
Baths
1,483
Sq Ft
$337/Sq Ft
Est. Value
About This Home
This home is located at 870 Ruby Ave, Reno, NV 89503 and is currently estimated at $499,168, approximately $336 per square foot. 870 Ruby Ave is a home located in Washoe County with nearby schools including Elmcrest Elementary School, Archie Clayton Pre-AP Academy, and Robert McQueen High School.
Ownership History
Date
Name
Owned For
Owner Type
Purchase Details
Closed on
Aug 17, 2015
Sold by
Gowins Robert Jason and Gowins Laurie
Bought by
Gowins Living Trust
Current Estimated Value
Purchase Details
Closed on
Mar 22, 2001
Sold by
Newbould Frances and Sbriglia Frances
Bought by
Gowins Robert Jason and Gowins Laurie Lee
Home Financials for this Owner
Home Financials are based on the most recent Mortgage that was taken out on this home.
Original Mortgage
$110,400
Outstanding Balance
$39,314
Interest Rate
7.06%
Estimated Equity
$459,854
Purchase Details
Closed on
Dec 28, 1993
Sold by
Sbriglia Patrick L and Sbriglia Frances L
Bought by
Sbriglia Frances L
Home Financials for this Owner
Home Financials are based on the most recent Mortgage that was taken out on this home.
Original Mortgage
$87,000
Interest Rate
7.38%
Create a Home Valuation Report for This Property
The Home Valuation Report is an in-depth analysis detailing your home's value as well as a comparison with similar homes in the area
Home Values in the Area
Average Home Value in this Area
Purchase History
| Date | Buyer | Sale Price | Title Company |
|---|---|---|---|
| Gowins Living Trust | -- | None Available | |
| Gowins Robert Jason | $138,000 | Stewart Title Northern Nevad | |
| Newbould Frances | -- | Stewart Title Northern Nevad | |
| Sbriglia Frances L | -- | Founders Title Company |
Source: Public Records
Mortgage History
| Date | Status | Borrower | Loan Amount |
|---|---|---|---|
| Open | Gowins Robert Jason | $110,400 | |
| Previous Owner | Sbriglia Frances L | $87,000 | |
| Closed | Gowins Robert Jason | $20,700 |
Source: Public Records
Tax History
| Year | Tax Paid | Tax Assessment Tax Assessment Total Assessment is a certain percentage of the fair market value that is determined by local assessors to be the total taxable value of land and additions on the property. | Land | Improvement |
|---|---|---|---|---|
| 2026 | $940 | $71,487 | $42,299 | $29,188 |
| 2025 | $1,225 | $71,002 | $41,785 | $29,217 |
| 2024 | $1,225 | $68,409 | $39,359 | $29,050 |
| 2023 | $1,190 | $68,169 | $41,160 | $27,009 |
| 2022 | $1,156 | $54,890 | $33,075 | $21,816 |
| 2021 | $1,124 | $43,801 | $22,307 | $21,494 |
| 2020 | $1,089 | $42,450 | $20,984 | $21,466 |
| 2019 | $1,058 | $41,884 | $21,315 | $20,569 |
| 2018 | $1,027 | $35,022 | $15,178 | $19,844 |
| 2017 | $998 | $33,244 | $13,561 | $19,683 |
| 2016 | $977 | $31,681 | $11,907 | $19,774 |
| 2015 | $976 | $29,498 | $10,106 | $19,392 |
| 2014 | $948 | $27,561 | $9,004 | $18,557 |
| 2013 | -- | $24,788 | $6,431 | $18,357 |
Source: Public Records
Map
Nearby Homes
- 1801 Carlin St
- 16 Raymond Dr
- 1695 Severn Dr
- 1045 Hartford Ct
- 1620 Harold Dr
- 1060 Whitaker Dr
- 2071 W 4th St Unit 42
- 1720 Grandview Ave
- 664 James Ln
- 2091 W 4th St
- 840 Brookfield Dr
- 3020 Kings Row
- 4233 Fawnridge Place
- 4232 Fawnridge Place
- 1495 Exeter Way
- 3085 Kings Row
- 1540 O Farrell St
- 1206 Freddie Ct
- 1169 Wagon Wheel Cir
- 1181 Wagon Wheel Cir
Your Personal Tour Guide
Ask me questions while you tour the home.