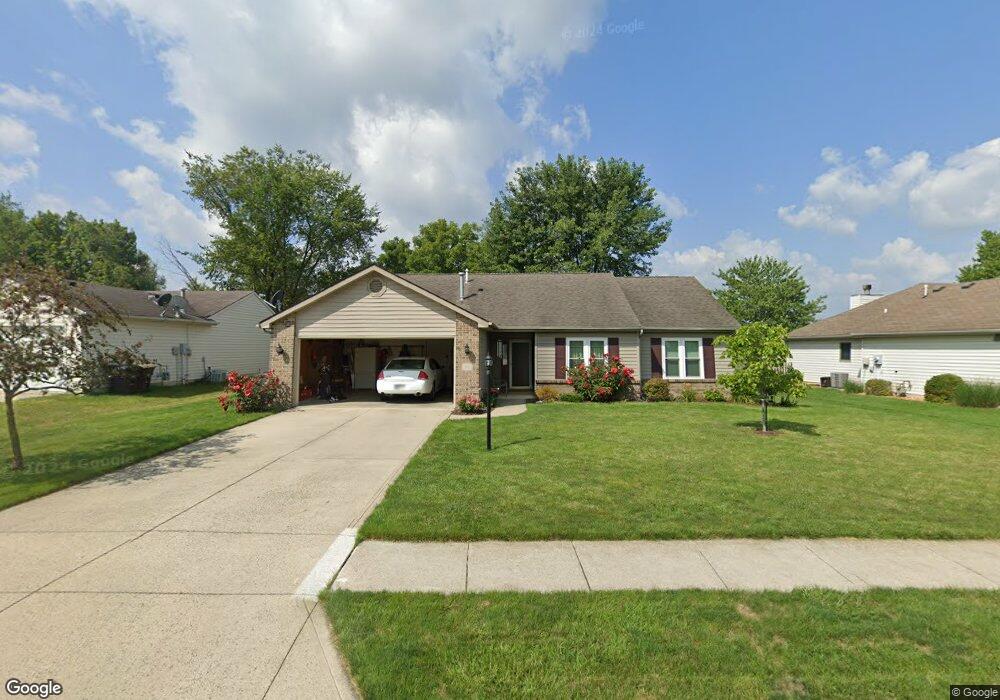
8701 Crosier Ln Fort Wayne, IN 46825
Northwest Fort Wayne NeighborhoodEstimated Value: $257,769 - $266,000
3
Beds
2
Baths
1,440
Sq Ft
$181/Sq Ft
Est. Value
About This Home
This home is located at 8701 Crosier Ln, Fort Wayne, IN 46825 and is currently estimated at $260,442, approximately $180 per square foot. 8701 Crosier Ln is a home located in Allen County with nearby schools including Lincoln Elementary School, Shawnee Middle School, and Northrop High School.
Ownership History
Date
Name
Owned For
Owner Type
Purchase Details
Closed on
May 28, 2020
Sold by
Schlup Sharon K
Bought by
Schlup Sharon K and Buzzard Gregory Lloyd
Current Estimated Value
Purchase Details
Closed on
Aug 17, 2007
Sold by
Schweigerdt William A and Schweigerdt Nancy S
Bought by
Schlup Robert N and Schlup Sharon K
Home Financials for this Owner
Home Financials are based on the most recent Mortgage that was taken out on this home.
Original Mortgage
$84,900
Outstanding Balance
$54,056
Interest Rate
6.77%
Mortgage Type
Purchase Money Mortgage
Estimated Equity
$206,386
Purchase Details
Closed on
Nov 9, 2001
Sold by
Heller & Sons Inc
Bought by
Schweigerdt William A and Schweigerdt Nancy S
Home Financials for this Owner
Home Financials are based on the most recent Mortgage that was taken out on this home.
Original Mortgage
$85,500
Interest Rate
6.69%
Purchase Details
Closed on
Feb 7, 2001
Sold by
Wallen Chase Llc
Bought by
Heller & Sons Inc
Create a Home Valuation Report for This Property
The Home Valuation Report is an in-depth analysis detailing your home's value as well as a comparison with similar homes in the area
Home Values in the Area
Average Home Value in this Area
Purchase History
| Date | Buyer | Sale Price | Title Company |
|---|---|---|---|
| Schlup Sharon K | -- | Fidelity National Ttl Co Llc | |
| Schlup Robert N | -- | Lawyers Title | |
| Schweigerdt William A | -- | Three Rivers Title Company | |
| Heller & Sons Inc | -- | Three Rivers Title Company |
Source: Public Records
Mortgage History
| Date | Status | Borrower | Loan Amount |
|---|---|---|---|
| Open | Schlup Robert N | $84,900 | |
| Previous Owner | Schweigerdt William A | $85,500 |
Source: Public Records
Tax History Compared to Growth
Tax History
| Year | Tax Paid | Tax Assessment Tax Assessment Total Assessment is a certain percentage of the fair market value that is determined by local assessors to be the total taxable value of land and additions on the property. | Land | Improvement |
|---|---|---|---|---|
| 2024 | $2,436 | $222,500 | $34,800 | $187,700 |
| 2023 | $2,431 | $214,500 | $34,800 | $179,700 |
| 2022 | $2,150 | $192,100 | $34,800 | $157,300 |
| 2021 | $1,934 | $174,000 | $25,700 | $148,300 |
| 2020 | $1,714 | $158,100 | $25,700 | $132,400 |
| 2019 | $1,585 | $147,200 | $25,700 | $121,500 |
| 2018 | $1,435 | $133,100 | $25,700 | $107,400 |
| 2017 | $1,333 | $123,200 | $25,700 | $97,500 |
| 2016 | $1,208 | $113,400 | $25,700 | $87,700 |
| 2014 | $1,157 | $112,700 | $25,700 | $87,000 |
| 2013 | $1,100 | $107,400 | $25,700 | $81,700 |
Source: Public Records
Map
Nearby Homes
- 8620 Shearwater Pass
- 8827 Crosier Ln
- 8627 Tara Ct
- 8921 Crosier Ln
- 2705 Riveroak Dr
- 1529 Citation Ln
- 1913 Falcon Hill Place
- 1289 Bunting Dr
- 1252 Bunting Dr
- 3007 Shelbourne Ct
- 1385 Bunting Dr
- 1222 Bunting Dr
- 3018 Caradoza Cove
- 1208 Bunting Dr
- 8992 Wings Pass
- 9022 Wings Pass
- 8958 Wings Pass
- 1190 Bunting Dr
- 1176 Bunting Dr
- 9710 Auburn Rd
- 8631 Crosier Ln
- 8709 Crosier Ln
- 8619 Crosier Ln
- 8717 Crosier Ln
- 8704 Crosier Ln
- 8716 Goshawk Ln
- 8710 Crosier Ln
- 8632 Crosier Ln
- 8607 Crosier Ln
- 8620 Crosier Ln
- 8725 Crosier Ln
- 8718 Crosier Ln
- 8527 Crosier Ln
- 8708 Goshawk Ln
- 8608 Crosier Ln
- 8724 Crosier Ln
- 8724 Goshawk Ln
- 8805 Crosier Ln
- 8703 Shearwater Pass
- 8633 Shearwater Pass